The first three pictures are question 1. The last two pictures are question 2.
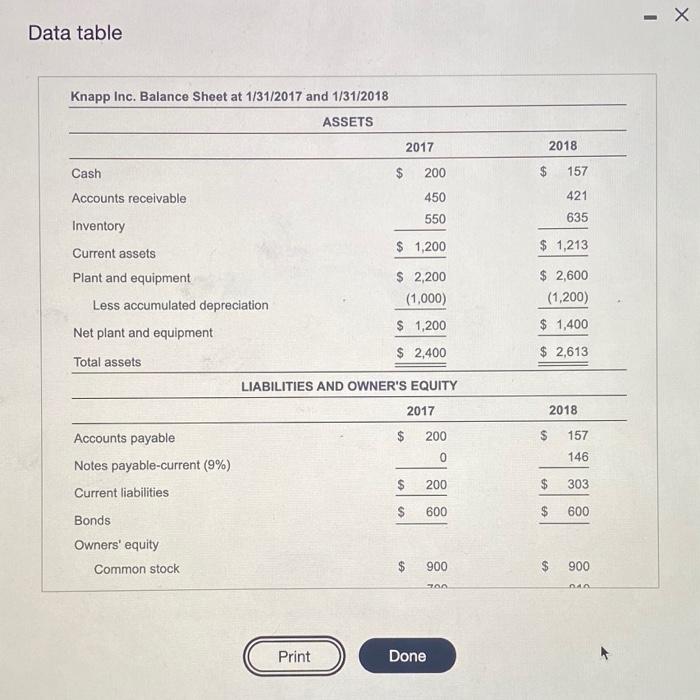
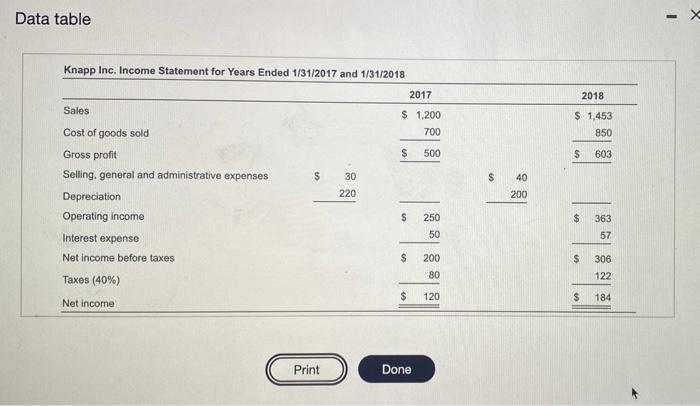
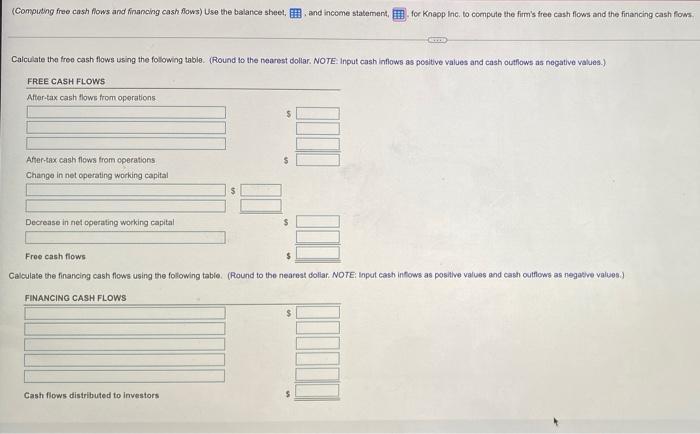
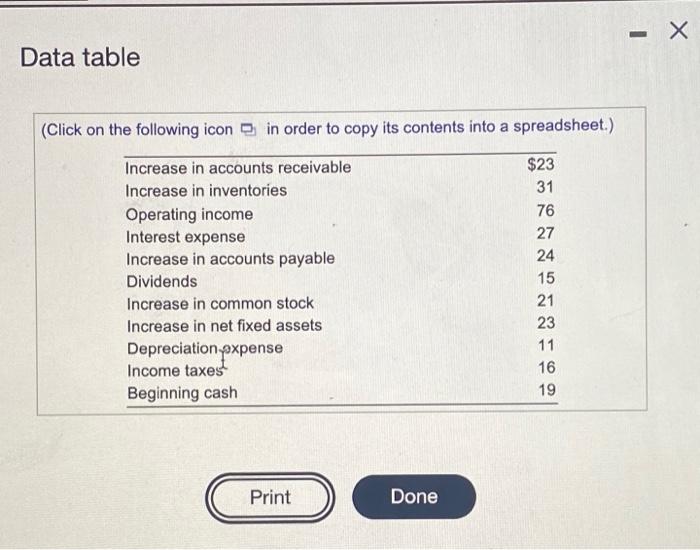
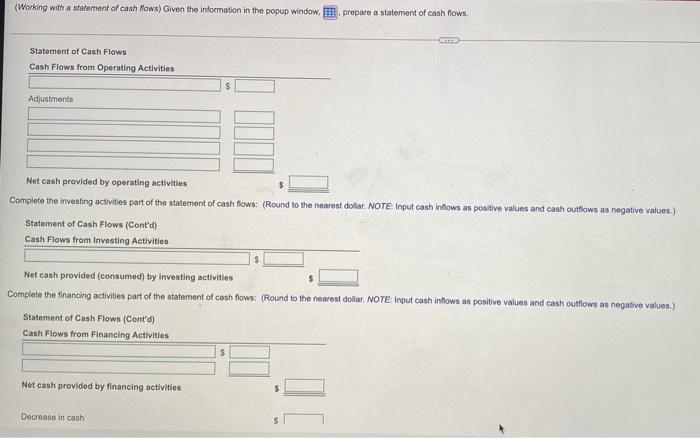
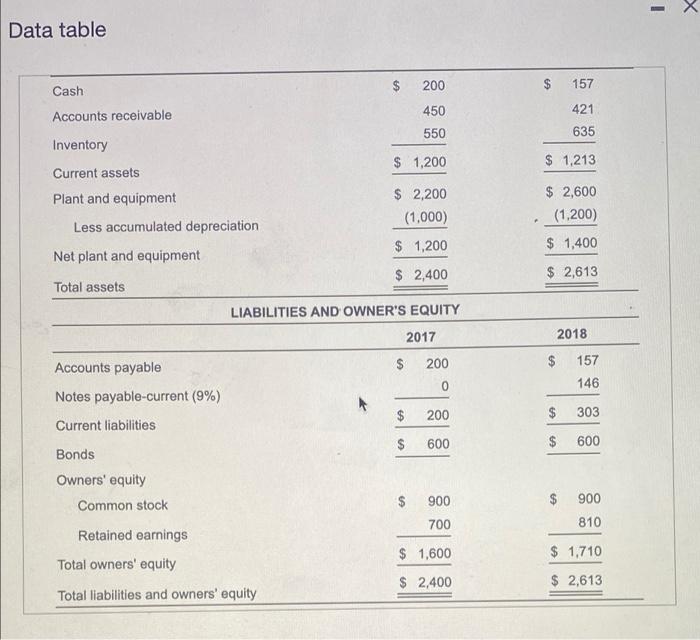
- Data table Knapp Inc. Balance Sheet at 1/31/2017 and 1/31/2018 ASSETS 2018 2017 $ 200 Cash 157 Accounts receivable 450 421 550 635 Inventory $ 1,200 $ 1,213 Current assets Plant and equipment Less accumulated depreciation Net plant and equipment $ 2,200 (1,000) $ 1,200 $ 2,400 $ 2,600 (1,200) $ 1,400 $ 2,613 Total assets LIABILITIES AND OWNER'S EQUITY 2017 $ 200 2018 $ 157 146 0 $ 200 303 Accounts payable Notes payable-current (9%) Current liabilities Bonds Owners' equity Common stock $ 600 $ 600 $ 900 $ 900 TA DA Print Done Data table 2018 $ 1,453 850 $ 603 $ 40 Knapp Inc. Income Statement for Years Ended 1/31/2017 and 1/31/2018 2017 Sales $ 1.200 Cost of goods sold 700 Gross profit $ 500 Selling, general and administrative expenses $ 30 220 Depreciation Operating income $ 250 50 Interest expense Net income before taxes $ 200 80 Taxes (40%) $ 120 Net income 200 $ 363 57 $ 306 122 $ 184 Print Done (Computing free cash flows and Mancing cash flows) Use the balance sheet, and income statement for Knapp Inc. to compute the firm's free cash flows and the financing cash flows Calculate the free cash flows using the following table. (Round to the nearest dollar. NOTE. Input cash inflows as positive values and cash outflows as negative values.) FREE CASH FLOWS After-tax cash flows from operations $ After-tax cash flows from operations Change in net operating working capital Decrease in net operating working capital $ Free cash flows Calculate the financing cash flows using the following table (Round to the nearest dollar. NOTE: Input cash inflows as positive values and cash outflows as negative values) FINANCING CASH FLOWS $ Cash flows distributed to investors Data table (Click on the following icon in order to copy its contents into a spreadsheet.) Increase in accounts receivable Increase in inventories Operating income Interest expense Increase in accounts payable Dividends Increase in common stock Increase in net fixed assets Depreciation expense Income taxes Beginning cash $23 31 76 27 24 15 21 23 11 16 19 Print Done (Working with a statement of cash flows) Given the information in the popup window, prepare a statement of cash flows. CE Statement of Cash Flows Cash Flows from Operating Activities Adjustments Net cash provided by operating activities Complete the investing activities part of the statement of cash flows: (Round to the nearest dollar. NOTE Input cash inflows as positive values and cash outflows as negative values.) Statement of Cash Flows (Cont'd) Cash Flows from Investing Activities Net cash provided (consumed) by Investing activities Complete the financing activities part of the statement of cash flows: (Round to the nearest dollar. NOTE Input cash inflows as positive values and cash outflows as negative values.) Statement of Cash Flows (Cont'd) Cash Flows from Financing Activities $ Net cash provided by financing activities Decrease in cash Data table $ Cash 200 $ 157 Accounts receivable 450 550 421 635 Inventory $ 1,200 $ 1,213 Current assets Plant and equipment Less accumulated depreciation $ 2,200 (1,000) $ 2,600 (1,200) $ 1,200 $ 1,400 Net plant and equipment $ 2,400 $ 2,613 Total assets LIABILITIES AND OWNER'S EQUITY 2017 2018 Accounts payable $ 200 157 146 0 Notes payable-current (9%) $ 200 $ 303 Current liabilities $ 600 $ 600 Bonds Owners' equity Common stock 900 $ 900 700 810 Retained earnings Total owners' equity $ 1,600 $ 1,710 $ 2,400 $ 2,613 Total liabilities and owners' equity
