

Question
The focus of this case is on the determination of the discount rate to apply in a capital expenditure analysis. To determine the discount rate,
The focus of this case is on the determination of the discount rate to apply in a capital expenditure analysis.
To determine the discount rate, the conceptual approach is to apply the cost of financing imposed by the investors in the project; that is, one determines the required rates of return the investors establish as they decide to invest in the project. These rates reflect the risks that investors assume by putting their money into the project.
There are two main types of investors: equity investors (owners) and debt investors (lenders). These two investor types typically impose different rates. The case aims to develop an understanding of how these rates are determined.
There are two main types of risk: business risk and financial risk. The case aims to develop an understanding of both business risk and financial risk and how each affects the rates of return required by debt and equity investors.
In developing the discount rate you will need to use:
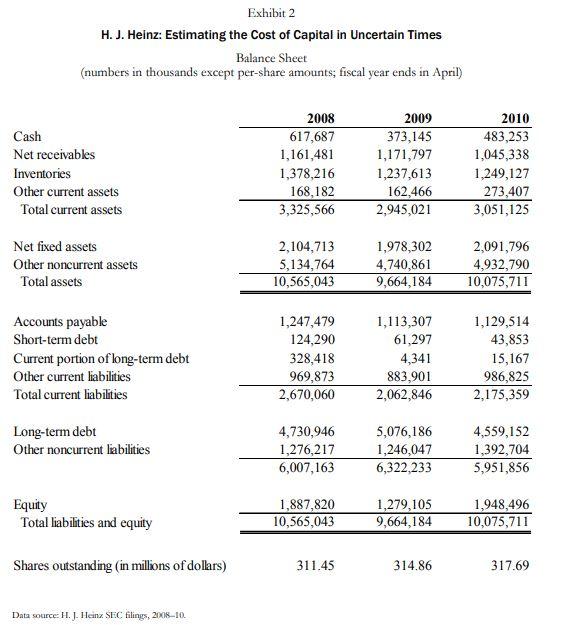
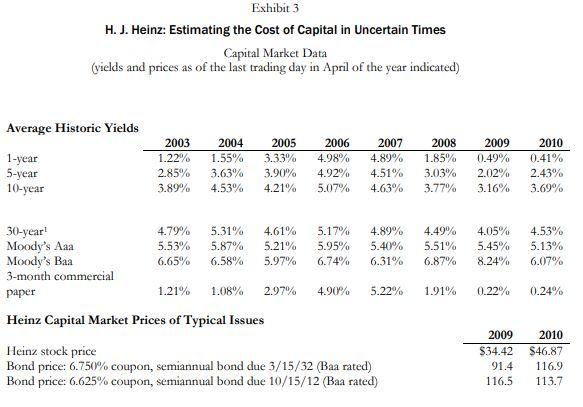
- The formula for the weighted average cost of capital (WACC). This formula combines the cost of debt and equity financing. There are two sorta tricky issues here. The first involves the valuation of debt. Financial economists differ on how to value debt in deriving the weight of debt in the WACC. For this case, lets use the book value of long term debt on the Heinz balance sheet, including the current portion of long term debt and excluding other noncurrent liabilities). This approach means that the financing ratios in calculating the WACC will reflect permanent financing. The second issue involves finding the current interest rate on debt. Note that it is incorrect to use the historical interest rate on debt, which is often reflected in the coupon rate. That rate is given in the case. Rather, one needs to find the rate that Heinz would pay if it went into the debt markets at the time of the case. Lets use the long term bonds maturing in 2032 as the basis for calculating Heinzs rD. You will need to use the model for bond price determination covered in the first fortnight of the course to solve for the current yield to maturity.
- The capital asset pricing model (CAPM). This model is used to estimate the cost of equity financing. Here are some assumptions to get everyone on the same page. For rf, lets use the 10-year Treasury bond yield given in the case. For the market risk premium, lets use the long term average risk premium given in the case.
- The stock price model. Lets use my preferred model: stock price = EPS/(rE-g). You will need to solve this equation to answer question 2 below.
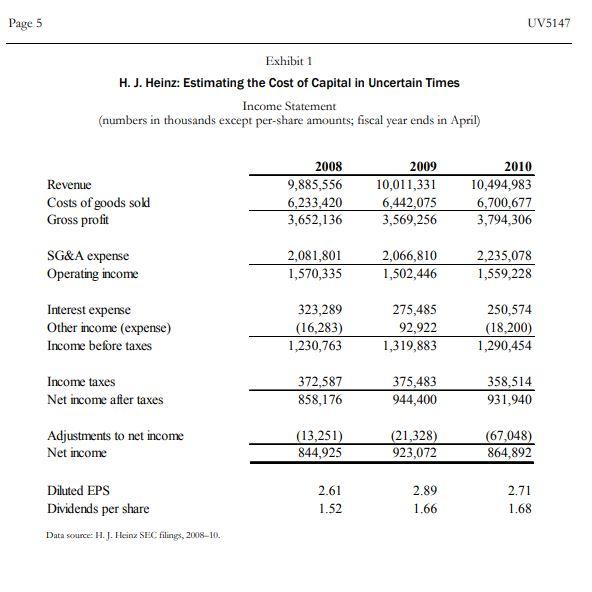
The changes in the tax code in 2017 affected the discount rate. Assume the tax rate stated in the case applies. Also, there is an error at the bottom of Exhibit 2. The last line should read: Shares outstanding (in millions).
1. What does the CAPM result say about equity cost in 2010?
2. Lets assume that Heinzs expected growth in earnings is 3% per year. (This rate is not too inconsistent with some of the numbers in Exhibit 1.) Apply the stock price model to estimate the required return on equity in 2010. How does this rate compare to the rate resulting from application of the CAPM?
3. What does your calculated interest rate, compared to the coupon rate on the bonds, imply about changes in interest rates and why? In qualitative terms, what happened to the Heinz bond rate between 2009 and 2010?
4. Calculate the WACC using the cost of equity you found by applying the CAPM. What does the WACC say about overall financing cost?
5. To what use might Heinz put the WACC?
6. How do you characterize Heinzs business risk? Is it relatively high or low?
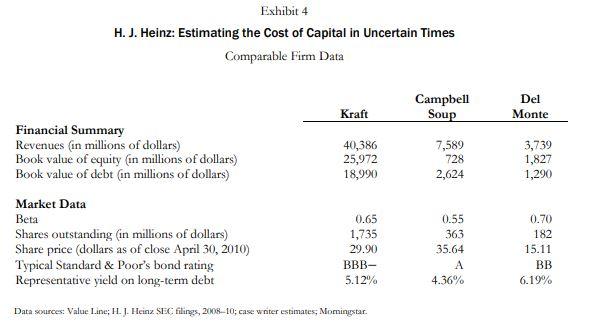
7. How would you characterize Heinzs financial risk? Is it higher or lower than that of comparable firms?
8. How are business risk and financial risk reflected in the CAPM?
Page 5 UV5147 Exhibit 1 H. J. Heinz: Estimating the Cost of Capital in Uncertain Times Income Statement (numbers in thousands except per-share amounts; fiscal year ends in April) Revenue Costs of goods sold Gross profit 2008 9,885,556 6,233,420 3,652,136 2009 10,011,331 6,442,075 3,569,256 2010 10,494,983 6,700,677 3,794,306 SG&A expense Operating income 2,081,801 1,570,335 2,066,810 1,502,446 2,235,078 1,559,228 Interest expense Other income (expense) Income before taxes 323,289 (16,283) 1,230,763 275,485 92,922 1,319,883 250,574 (18,200) 1,290,454 Income taxes Net income after taxes 372,587 858,176 375,483 944,400 358,514 931,940 Adjustments to net income Net income (13,251) 844,925 (21,328) 923,072 (67,048) 864,892 Diluted EPS Dividends per share Data sexurce: H. J. Heinz SEC filings, 2008-10. 2.61 1.52 2.89 1.66 2.71 1.68 Exhibit 2 H. J. Heinz: Estimating the Cost of Capital in Uncertain Times Balance Sheet (numbers in thousands except per-share amounts; fiscal year ends in April) Cash Net receivables Inventories Other current assets Total current assets 2008 617,687 1,161,481 1,378,216 168,182 3,325,566 2009 373,145 1,171,797 1,237,613 162,466 2,945,021 2010 483,253 1,045,338 1,249,127 273,407 3,051,125 Net fixed assets Other noncurrent assets Total assets 2,104,713 5,134,764 10,565,043 1,978,302 4,740,861 9,664,184 2,091,796 4,932,790 10,075,711 Accounts payable Short-term debt Current portion of long-term debt Other current liabilities Total current liabilities 1,247,479 124,290 328,418 969,873 2,670,060 1,113,307 61,297 4,341 883,901 2,062,846 1,129,514 43,853 15,167 986,825 2,175,359 Long-term debt Other noncurrent liabilities 4,730,946 1,276,217 6,007,163 5,076,186 1,246,047 6,322,233 4,559,152 1,392,704 5,951,856 Equity Total liabilities and equity 1,887,820 10,565,043 1,279,105 9,664,184 1,948,496 10,075,711 Shares outstanding (in millions of dollars) 311.45 314.86 317.69 Data source: H. J. Heinz SEC filings, 2018-10. Exhibit 3 H. J. Heinz: Estimating the Cost of Capital in Uncertain Times Capital Market Data (vields and prices as of the last trading day in April of the year indicated) Average Historic Yields 1-year 5-year 10-year 2003 1.22% 2.85% 3.89% 2004 1.55% 3.63% 4.53% 2005 3.33% 3.90% 4.21% 2006 4.98% 4.92% 5.07% 2007 4.89% 4.51% 4.63% 2008 1.85% 3.03% 3.77% 2009 0.49% 2.02% 3.16% 2010 0.41% 2.43% 3.69% 30-year! Moody's Aaa Moody's Baa 3-month commercial paper 4.79% 5.53% 6,65% 5.31% 5.87% 6.58% 4.61% 5.21% 5.97% 5.17% 5.95% 6.74% 89% 5.40% 6.31% 4.49% 5.51% 6.87% 1,05% 5.45% 8.24% 4.53% 5.13% 6.07% 1.21% 1.08% 2.97% 4.90% 5.22% 1.91% 0.22% 0.24% Heinz Capital Market Prices of Typical Issues Heinz stock price Bond price: 6.750% coupon, semiannual bond due 3/15/32 (Baa rated) Bond price: 6.625% coupon, semiannual bond due 10/15/12 (Baa rated) 2009 $34.42 91.4 116.5 2010 $46.87 116.9 113.7 Exhibit 4 H. J. Heinz: Estimating the cost of Capital in Uncertain Times Comparable Firm Data Campbell Soup Del Monte Kraft 40,386 25,972 18,990 7,589 728 2,624 3,739 1,827 1,290 Financial Summary Revenues (in millions of dollars) Book value of equity (in millions of dollars) Book value of debt (in millions of dollars) Market Data Beta Shares outstanding (in millions of dollars) Share price (dollars as of close April 30, 2010) Typical Standard & Poor's bond rating Representative yield on long-term debt 0.65 1,735 29.90 BBB- 5.12% 0.55 363 35.64 0.70 182 15.11 BB 6.19% 4.36% Data sources: Value Line; H. J. Heinz SEC filings, 2008-10; case writer estimates, Momingstar. Page 5 UV5147 Exhibit 1 H. J. Heinz: Estimating the Cost of Capital in Uncertain Times Income Statement (numbers in thousands except per-share amounts; fiscal year ends in April) Revenue Costs of goods sold Gross profit 2008 9,885,556 6,233,420 3,652,136 2009 10,011,331 6,442,075 3,569,256 2010 10,494,983 6,700,677 3,794,306 SG&A expense Operating income 2,081,801 1,570,335 2,066,810 1,502,446 2,235,078 1,559,228 Interest expense Other income (expense) Income before taxes 323,289 (16,283) 1,230,763 275,485 92,922 1,319,883 250,574 (18,200) 1,290,454 Income taxes Net income after taxes 372,587 858,176 375,483 944,400 358,514 931,940 Adjustments to net income Net income (13,251) 844,925 (21,328) 923,072 (67,048) 864,892 Diluted EPS Dividends per share Data sexurce: H. J. Heinz SEC filings, 2008-10. 2.61 1.52 2.89 1.66 2.71 1.68 Exhibit 2 H. J. Heinz: Estimating the Cost of Capital in Uncertain Times Balance Sheet (numbers in thousands except per-share amounts; fiscal year ends in April) Cash Net receivables Inventories Other current assets Total current assets 2008 617,687 1,161,481 1,378,216 168,182 3,325,566 2009 373,145 1,171,797 1,237,613 162,466 2,945,021 2010 483,253 1,045,338 1,249,127 273,407 3,051,125 Net fixed assets Other noncurrent assets Total assets 2,104,713 5,134,764 10,565,043 1,978,302 4,740,861 9,664,184 2,091,796 4,932,790 10,075,711 Accounts payable Short-term debt Current portion of long-term debt Other current liabilities Total current liabilities 1,247,479 124,290 328,418 969,873 2,670,060 1,113,307 61,297 4,341 883,901 2,062,846 1,129,514 43,853 15,167 986,825 2,175,359 Long-term debt Other noncurrent liabilities 4,730,946 1,276,217 6,007,163 5,076,186 1,246,047 6,322,233 4,559,152 1,392,704 5,951,856 Equity Total liabilities and equity 1,887,820 10,565,043 1,279,105 9,664,184 1,948,496 10,075,711 Shares outstanding (in millions of dollars) 311.45 314.86 317.69 Data source: H. J. Heinz SEC filings, 2018-10. Exhibit 3 H. J. Heinz: Estimating the Cost of Capital in Uncertain Times Capital Market Data (vields and prices as of the last trading day in April of the year indicated) Average Historic Yields 1-year 5-year 10-year 2003 1.22% 2.85% 3.89% 2004 1.55% 3.63% 4.53% 2005 3.33% 3.90% 4.21% 2006 4.98% 4.92% 5.07% 2007 4.89% 4.51% 4.63% 2008 1.85% 3.03% 3.77% 2009 0.49% 2.02% 3.16% 2010 0.41% 2.43% 3.69% 30-year! Moody's Aaa Moody's Baa 3-month commercial paper 4.79% 5.53% 6,65% 5.31% 5.87% 6.58% 4.61% 5.21% 5.97% 5.17% 5.95% 6.74% 89% 5.40% 6.31% 4.49% 5.51% 6.87% 1,05% 5.45% 8.24% 4.53% 5.13% 6.07% 1.21% 1.08% 2.97% 4.90% 5.22% 1.91% 0.22% 0.24% Heinz Capital Market Prices of Typical Issues Heinz stock price Bond price: 6.750% coupon, semiannual bond due 3/15/32 (Baa rated) Bond price: 6.625% coupon, semiannual bond due 10/15/12 (Baa rated) 2009 $34.42 91.4 116.5 2010 $46.87 116.9 113.7 Exhibit 4 H. J. Heinz: Estimating the cost of Capital in Uncertain Times Comparable Firm Data Campbell Soup Del Monte Kraft 40,386 25,972 18,990 7,589 728 2,624 3,739 1,827 1,290 Financial Summary Revenues (in millions of dollars) Book value of equity (in millions of dollars) Book value of debt (in millions of dollars) Market Data Beta Shares outstanding (in millions of dollars) Share price (dollars as of close April 30, 2010) Typical Standard & Poor's bond rating Representative yield on long-term debt 0.65 1,735 29.90 BBB- 5.12% 0.55 363 35.64 0.70 182 15.11 BB 6.19% 4.36% Data sources: Value Line; H. J. Heinz SEC filings, 2008-10; case writer estimates, MomingstarStep by Step Solution
There are 3 Steps involved in it
Step: 1

Get Instant Access to Expert-Tailored Solutions
See step-by-step solutions with expert insights and AI powered tools for academic success
Step: 2

Step: 3
Ace Your Homework with AI
Get the answers you need in no time with our AI-driven, step-by-step assistance
Get Started
Managerial Finance In A Canadian Setting
Authors: X. Lusztig, X. Schwab
4th Edition