Answered step by step
Verified Expert Solution
Question
1 Approved Answer
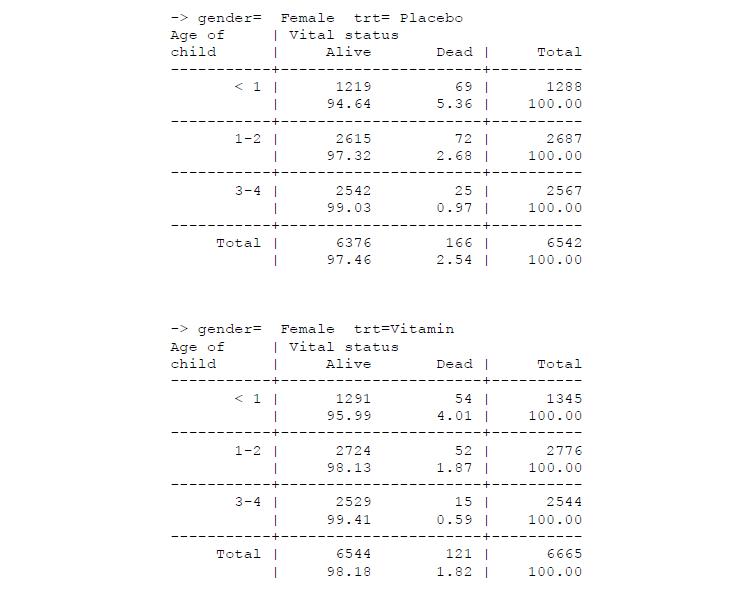
The following 3x2 tables derived from the Nepal mortality data show mortality at 16 months of follow-up for different ages of girls in both treatment
The following 3x2 tables derived from the Nepal mortality data show mortality at 16 months of follow-up for different ages of girls in both treatment groups.

i) What is the expected number of deaths in a 16-month period in a population of size 10?
ii) Describe the Poisson probability distribution for the number of deaths of Vitamin Atreated girls during 16 months of follow-up by filling in the table below:

-> gender= Female trt Placebo Age of | Vital status child Alive 1-2 3-4 I I Total | 1 -> gender= Age of child 1-2 2 3-4 I 1219 94.64 Total I 2615 97.32 2542 99.03 6376 97.46 1291 95.99 2724 98.13 Female trt Vitamin | Vital status I Alive 2529 99.41 I Dead I 6544 98.18 69 1 5.36 1 72 1 2.68 25 1 0.97 I 166 I 2.54 | Dead | 54 1 4.01 I 52 | 1.87 I 15 I 0.59 1 121 | 1.82 I Total 1288 100.00 2687 100.00 2567 100.00 6542 100.00 Total 1345 100.00 2776 100.00 2544 100.00 6665 100.00
Step by Step Solution
★★★★★
3.34 Rating (163 Votes )
There are 3 Steps involved in it
Step: 1

Get Instant Access to Expert-Tailored Solutions
See step-by-step solutions with expert insights and AI powered tools for academic success
Step: 2

Step: 3

Ace Your Homework with AI
Get the answers you need in no time with our AI-driven, step-by-step assistance
Get Started


