

Question
The following ANOVA table is testing for significant differences between employment groups in the number of sexual partners reported last year. Using only the information
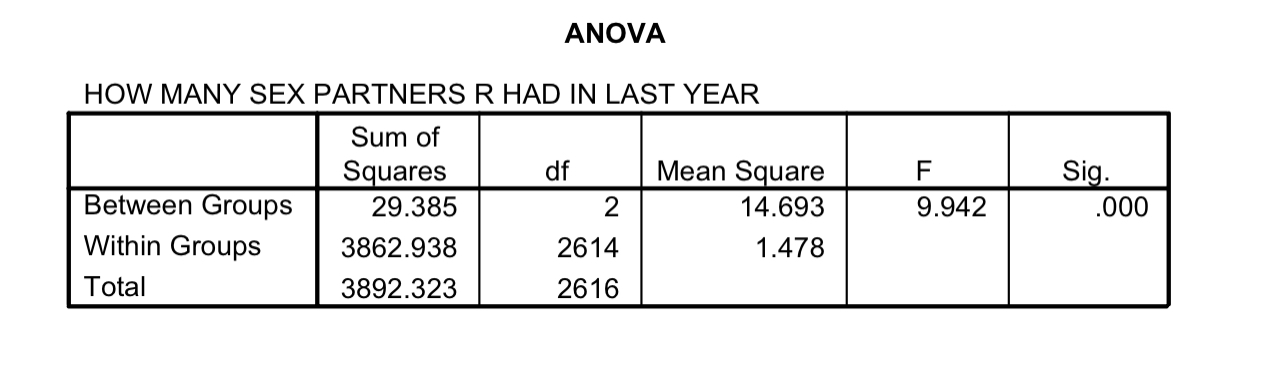
The following ANOVA table is testing for significant differences between employment groups in the number of sexual partners reported last year. Using only the information given:
a) Calculate how many categories of employment groups were analyzed
b) Give the total number of respondents surveyed.
Step by Step Solution
There are 3 Steps involved in it
Step: 1

Get Instant Access to Expert-Tailored Solutions
See step-by-step solutions with expert insights and AI powered tools for academic success
Step: 2

Step: 3
Ace Your Homework with AI
Get the answers you need in no time with our AI-driven, step-by-step assistance
Get Started
Measure Theory And Integration
Authors: M M Rao, MM Rao
2nd Edition
1351991485, 9781351991483