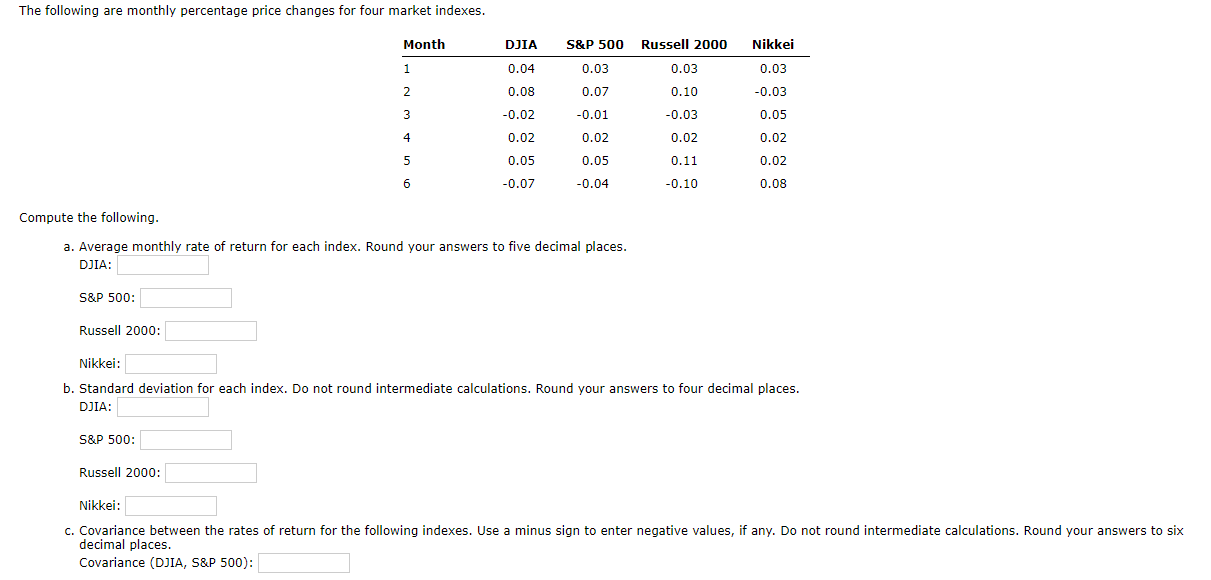
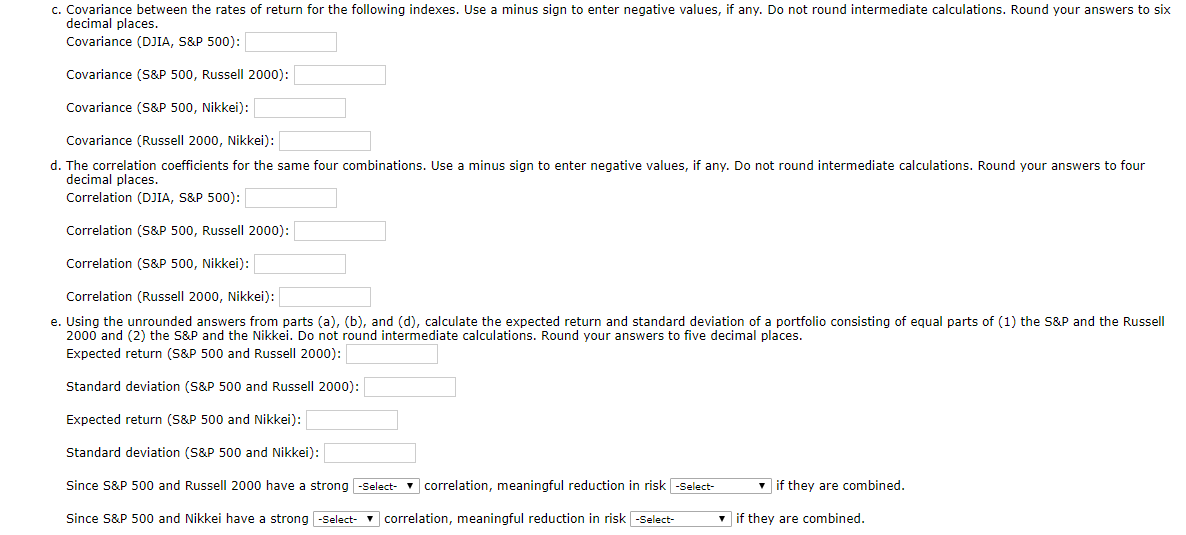
The following are monthly percentage price changes for four market indexes. Month Nikkei 0.10 DJIA 0.04 0.08 -0.02 0.02 0.05 -0.07 S&P 500 Russell 2000 0.03 0.03 0.07 -0.01 -0.03 0.02 0.02 0.05 0.11 -0.04 -0.10 0.03 -0.03 0.05 0.02 0.02 0.08 Compute the following. a. Average monthly rate of return for each index. Round your answers to five decimal places. DIA: S&P 500: Russell 2000: Nikkei: b. Standard deviation for each index. Do not round intermediate calculations. Round your answers to four decimal places. DIA: S&P 500: Russell 2000: Nikkei: C. Covariance between the rates of return for the following indexes. Use a minus sign to enter negative values, if any. Do not round intermediate calculations. Round your answers to six decimal places. Covariance (DJIA, S&P 500): c. Covariance between the rates of return for the following indexes. Use a minus sign to enter negative values, if any. Do not round intermediate calculations. Round your answers to six decimal places. Covariance (DJIA, S&P 500): Covariance (S&P 500, Russell 2000): Covariance (S&P 500, Nikkei): Covariance (Russell 2000, Nikkei): d. The correlation coefficients for the same four combinations. Use a minus sign to enter negative values, if any. Do not round intermediate calculations. Round your answers to four decimal places. Correlation (DJIA, S&P 500): Correlation (S&P 500, Russell 2000): Correlation (S&P 500, Nikkei): Correlation (Russell 2000, Nikkei): e. Using the unrounded answers from parts (a), (b), and (d), calculate the expected return and standard deviation of a portfolio consisting of equal parts of (1) the S&P and the Russell 2000 and (2) the S&P and the Nikkei. Do not round intermediate calculations. Round your answers to five decimal places. Expected return (S&P 500 and Russell 2000): Standard deviation (S&P 500 and Russell 2000): Expected return (S&P 500 and Nikkei): Standard deviation (S&P 500 and Nikkei): Since S&P 500 and Russell 2000 have a strong -Select- y correlation, meaningful reduction in risk -Select- if they are combined. Since S&P 500 and Nikkei have a strong -Select- y correlation, meaningful reduction in risk -Select- if they are combined. The following are monthly percentage price changes for four market indexes. Month Nikkei 0.10 DJIA 0.04 0.08 -0.02 0.02 0.05 -0.07 S&P 500 Russell 2000 0.03 0.03 0.07 -0.01 -0.03 0.02 0.02 0.05 0.11 -0.04 -0.10 0.03 -0.03 0.05 0.02 0.02 0.08 Compute the following. a. Average monthly rate of return for each index. Round your answers to five decimal places. DIA: S&P 500: Russell 2000: Nikkei: b. Standard deviation for each index. Do not round intermediate calculations. Round your answers to four decimal places. DIA: S&P 500: Russell 2000: Nikkei: C. Covariance between the rates of return for the following indexes. Use a minus sign to enter negative values, if any. Do not round intermediate calculations. Round your answers to six decimal places. Covariance (DJIA, S&P 500): c. Covariance between the rates of return for the following indexes. Use a minus sign to enter negative values, if any. Do not round intermediate calculations. Round your answers to six decimal places. Covariance (DJIA, S&P 500): Covariance (S&P 500, Russell 2000): Covariance (S&P 500, Nikkei): Covariance (Russell 2000, Nikkei): d. The correlation coefficients for the same four combinations. Use a minus sign to enter negative values, if any. Do not round intermediate calculations. Round your answers to four decimal places. Correlation (DJIA, S&P 500): Correlation (S&P 500, Russell 2000): Correlation (S&P 500, Nikkei): Correlation (Russell 2000, Nikkei): e. Using the unrounded answers from parts (a), (b), and (d), calculate the expected return and standard deviation of a portfolio consisting of equal parts of (1) the S&P and the Russell 2000 and (2) the S&P and the Nikkei. Do not round intermediate calculations. Round your answers to five decimal places. Expected return (S&P 500 and Russell 2000): Standard deviation (S&P 500 and Russell 2000): Expected return (S&P 500 and Nikkei): Standard deviation (S&P 500 and Nikkei): Since S&P 500 and Russell 2000 have a strong -Select- y correlation, meaningful reduction in risk -Select- if they are combined. Since S&P 500 and Nikkei have a strong -Select- y correlation, meaningful reduction in risk -Select- if they are combined