

Answered step by step
Verified Expert Solution
Question
1 Approved Answer
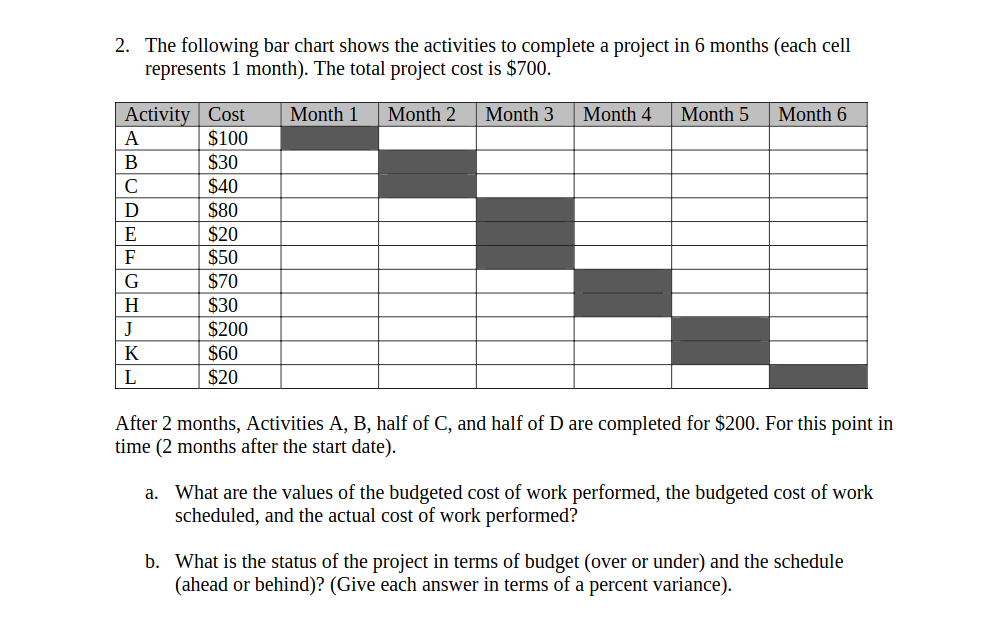
The following bar chart shows the activities to complete a project in 6 months ( each cell represents 1 month ) . The total project
The following bar chart shows the activities to complete a project in months each cell
represents month The total project cost is $
After months, Activities A B half of C and half of D are completed for $ For this point in
time months after the start date
a What are the values of the budgeted cost of work performed, the budgeted cost of work
scheduled, and the actual cost of work performed?
b What is the status of the project in terms of budget over or under and the schedule
ahead or behindGive each answer in terms of a percent variance
Step by Step Solution
There are 3 Steps involved in it
Step: 1

Get Instant Access to Expert-Tailored Solutions
See step-by-step solutions with expert insights and AI powered tools for academic success
Step: 2

Step: 3
Ace Your Homework with AI
Get the answers you need in no time with our AI-driven, step-by-step assistance
Get Started
Managerial Accounting
Authors: Kulp, Susan, Dragoo, Amie, Hartgraves, Al L, Morse Wayne J.
9th Edition
1618533622, 9781618533623