

Answered step by step
Verified Expert Solution
Question
1 Approved Answer
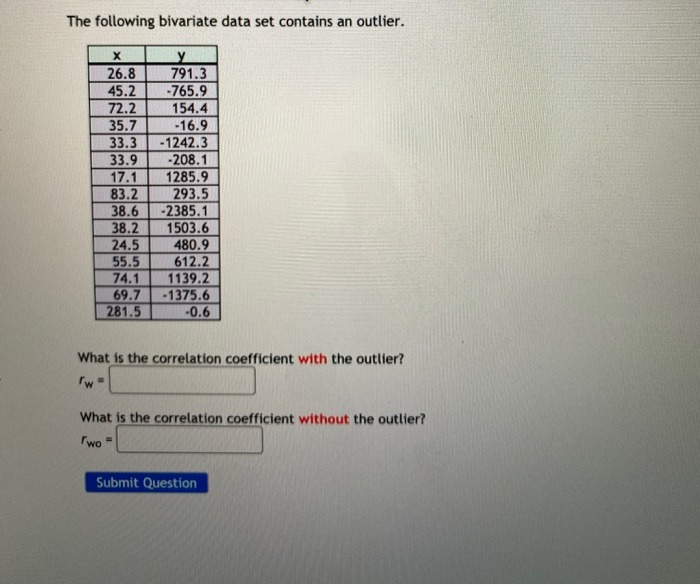
The following bivariate data set contains an outlier. X y 26.8 791.3 45.2 -765.9 72.2 154.4 35.7 -16.9 33.3 -1242.3 33.9 -208.1 17.1 1285.9 83.2
Step by Step Solution
There are 3 Steps involved in it
Step: 1

Get Instant Access to Expert-Tailored Solutions
See step-by-step solutions with expert insights and AI powered tools for academic success
Step: 2

Step: 3
Ace Your Homework with AI
Get the answers you need in no time with our AI-driven, step-by-step assistance
Get Started
Statistical Techniques in Business and Economics
Authors: Douglas A. Lind, William G Marchal
17th edition
1259666360, 978-1259666360