

Question
The following chart compares the average Land-Surface Air Temperatures for year since 1961 to the 20 th century average Land-Surface Air Temperature. At the ?
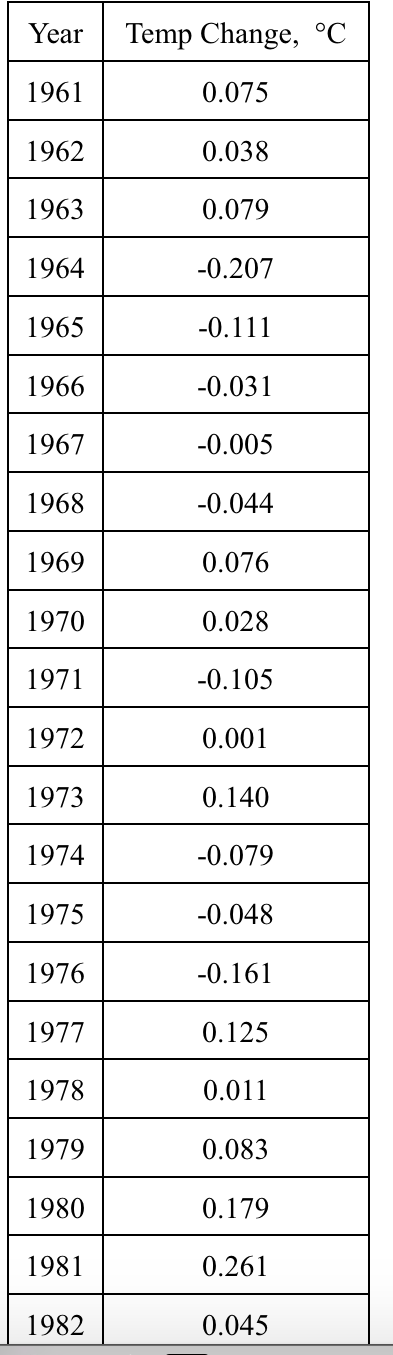
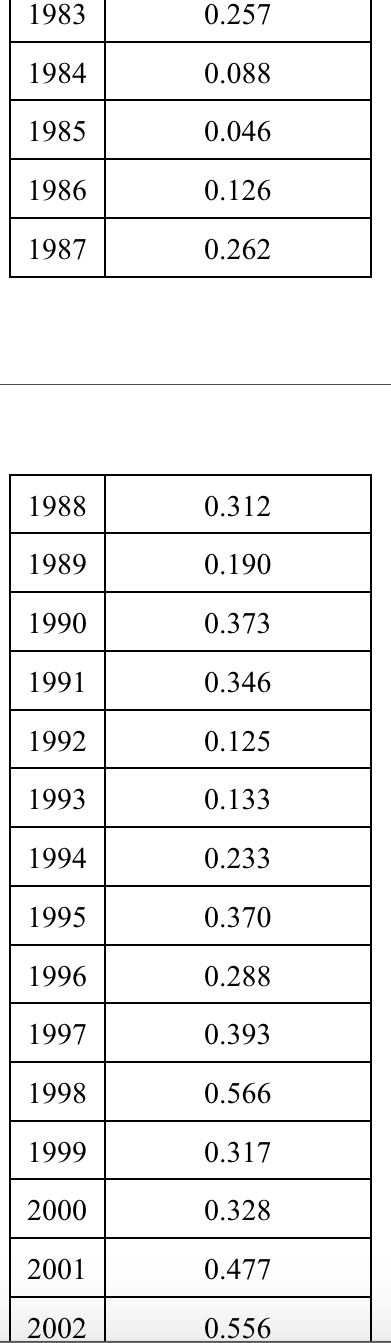
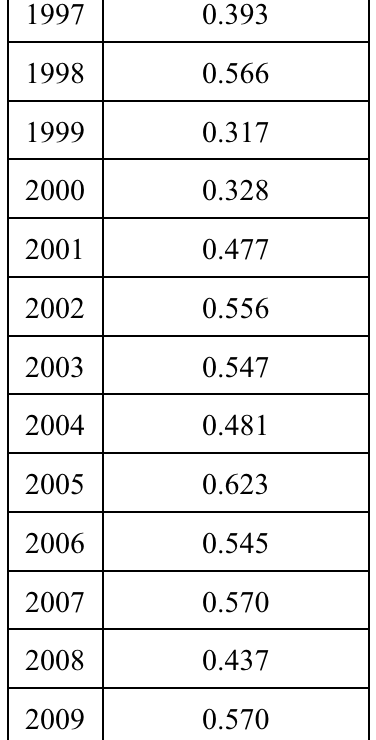
The following chart compares the average Land-Surface Air Temperatures for year since 1961 to the 20th century average Land-Surface Air Temperature.
At the ? = 0.05 significance level, conduct a hypothesis test for the claim that the mean Land-Surface Air Temperature has not changed (? = 0).Be sure to include your hypotheses, the critical value(s), the standardized test statistic, and your initial and final conclusions.
Step by Step Solution
There are 3 Steps involved in it
Step: 1

Get Instant Access to Expert-Tailored Solutions
See step-by-step solutions with expert insights and AI powered tools for academic success
Step: 2

Step: 3
Ace Your Homework with AI
Get the answers you need in no time with our AI-driven, step-by-step assistance
Get Started
Advanced Engineering Mathematics
Authors: Erwin Kreyszig
10th edition
470458364, 470458365, 978-0470458365