

Answered step by step
Verified Expert Solution
Question
1 Approved Answer
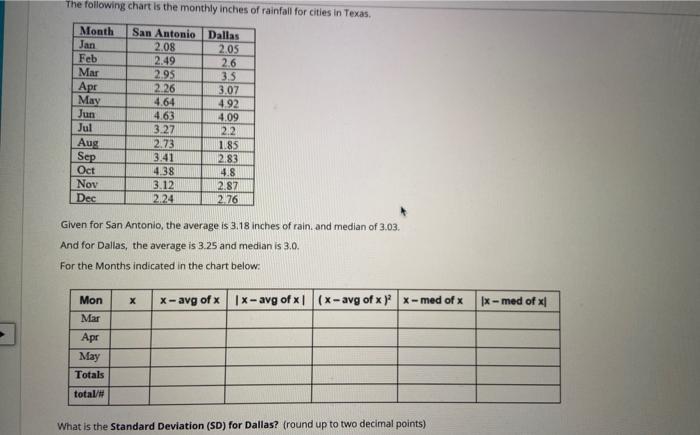
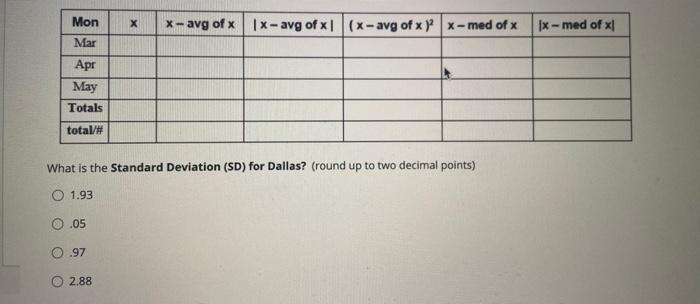
The following chart is the monthly inches of rainfall for cities in Texas Month Jan Feb Mar Apr May Jun Jul Aug Sep Oct Nov
Step by Step Solution
There are 3 Steps involved in it
Step: 1

Get Instant Access to Expert-Tailored Solutions
See step-by-step solutions with expert insights and AI powered tools for academic success
Step: 2

Step: 3
Ace Your Homework with AI
Get the answers you need in no time with our AI-driven, step-by-step assistance
Get Started
Database Design And Relational Theory Normal Forms And All That Jazz
Authors: Chris Date
1st Edition
1449328016, 978-1449328016