

Question
The following chart shows living wage jobs in Rochester per 1000 working age adults over a 5 year period Year 1997 1998 1999 2000 2001

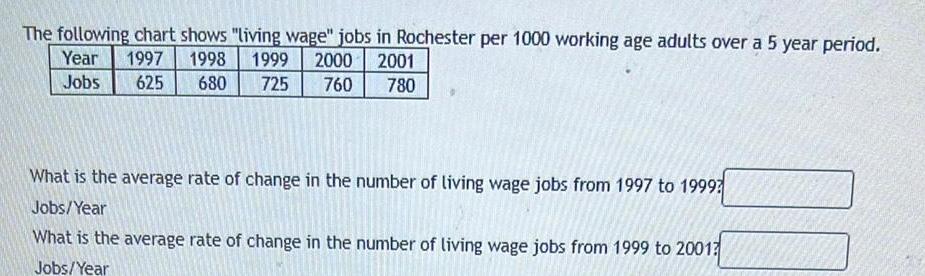
The following chart shows living wage jobs in Rochester per 1000 working age adults over a 5 year period Year 1997 1998 1999 2000 2001 Jobs 625 680 725 760 780 What is the average rate of change in the number of living wage jobs from 1997 to 1999 Jobs Year What is the average rate of change in the number of living wage jobs from 1999 to 2001 Jobs Year
Step by Step Solution
There are 3 Steps involved in it
Step: 1

Get Instant Access to Expert-Tailored Solutions
See step-by-step solutions with expert insights and AI powered tools for academic success
Step: 2

Step: 3
Ace Your Homework with AI
Get the answers you need in no time with our AI-driven, step-by-step assistance
Get Started
Game Theory And Climate Change
Authors: Parkash Chander
1st Edition
0231545592, 9780231545594