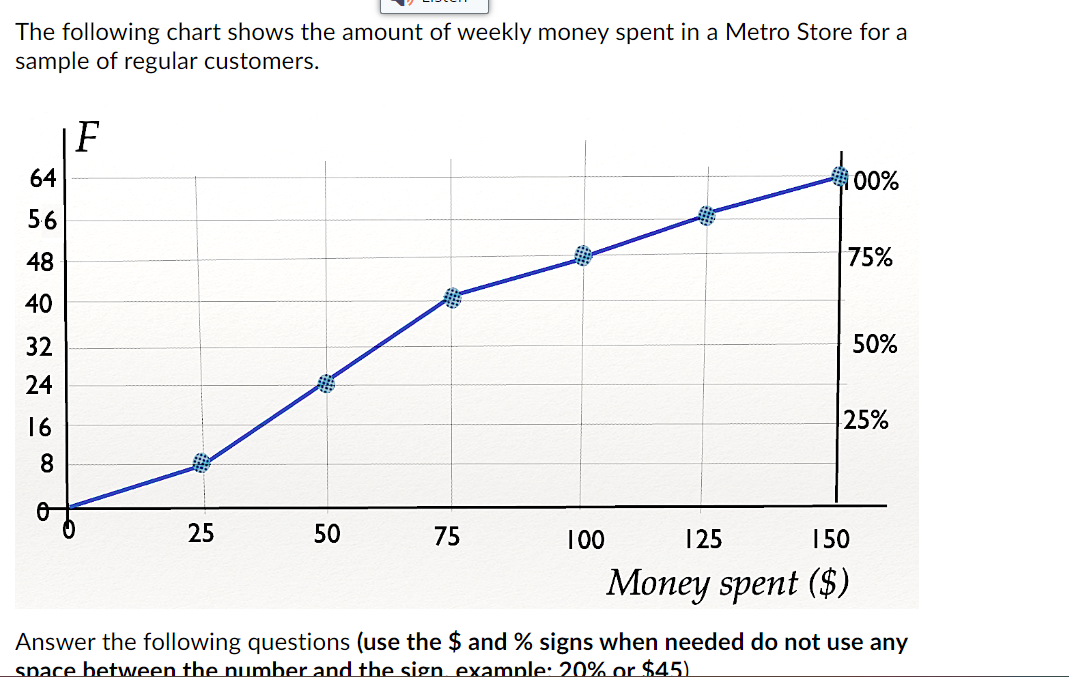
a ) How many customers were studied: b ) About how many customers spent less than $ 5 0 weekly? c ) About 7 5

a How many customers were studied:
b About how many customers spent less than $ weekly?
c About of the customers spent less than what amount?
d of the customers studied spend less than what amount?
e What percentage of the customers spent less than $ per week?
f In the frequency distribution table of this data what is the frequency of the third interval?
g In the frequency distribution table of this data what is the more than cumulative frequency of the second interval?
h About of the customers spent more than or equal to what amount?
The following chart shows the amount of weekly money spent in a Metro Store for a sample of regular customers. 64 6 5 56 F 00% 75% 48 40 32 24 16 68 25 50 75 100 125 150 50% 25% Money spent ($) Answer the following questions (use the $ and % signs when needed do not use any space between the number and the sign. example: 20% or $45)
Step by Step Solution
There are 3 Steps involved in it
Step: 1
Solutions Step 1 Explanation a The number of customers studied is the number of data points on the graph which is 6 b Customers who spent less than 50 ...
See step-by-step solutions with expert insights and AI powered tools for academic success
Step: 2

Step: 3

Ace Your Homework with AI
Get the answers you need in no time with our AI-driven, step-by-step assistance
Get Started


