Answered step by step
Verified Expert Solution
Question
1 Approved Answer
The following chart shows the selected financial data for Rutherford and PC&B Inc., at the end of the current year. Both companies are in

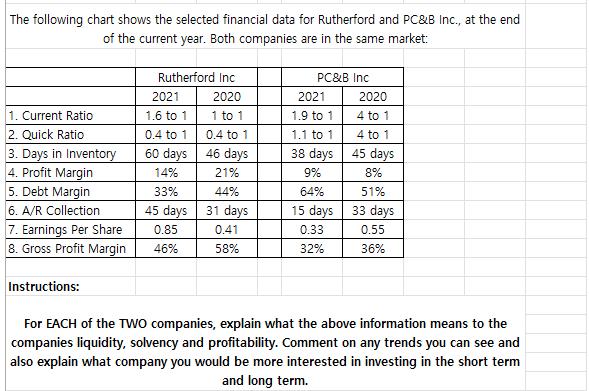
The following chart shows the selected financial data for Rutherford and PC&B Inc., at the end of the current year. Both companies are in the same market: Rutherford Inc PC&B Inc 2021 2020 2021 2020 1. Current Ratio 1.6 to 1 1 to 1 1.9 to 1 4 to 1 2. Quick Ratio 0.4 to 1 0.4 to 1 1.1 to 1 4 to 1 3. Days in Inventory 60 days 46 days 38 days 45 days 4. Profit Margin 14% 21% 9% 8% 5. Debt Margin 33% 44% 64% 51% 6. A/R Collection 45 days 31 days 15 days 33 days 7. Earnings Per Share 0.85 0.41 0.33 0.55 8. Gross Profit Margin 46% 58% 32% 36% Instructions: For EACH of the TWO companies, explain what the above information means to the companies liquidity, solvency and profitability. Comment on any trends you can see and also explain what company you would be more interested in investing in the short term and long term.
Step by Step Solution
There are 3 Steps involved in it
Step: 1
Lets analyze the financial data for Rutherford Inc and PCB Inc and discuss their liquidity solvency and profitability Rutherford Inc Current Ratio The current ratio measures the companys ability to pa...
Get Instant Access to Expert-Tailored Solutions
See step-by-step solutions with expert insights and AI powered tools for academic success
Step: 2

Step: 3

Document Format ( 2 attachments)
663dbf52ea4c5_962727.pdf
180 KBs PDF File
663dbf52ea4c5_962727.docx
120 KBs Word File
Ace Your Homework with AI
Get the answers you need in no time with our AI-driven, step-by-step assistance
Get Started


