Answered step by step
Verified Expert Solution
Question
1 Approved Answer
The following condensed information is available for Brick Brewing Company Ltd.: Brick Brewing Co. Limited Statement of Financial Position January 31 (in thousands) 2019
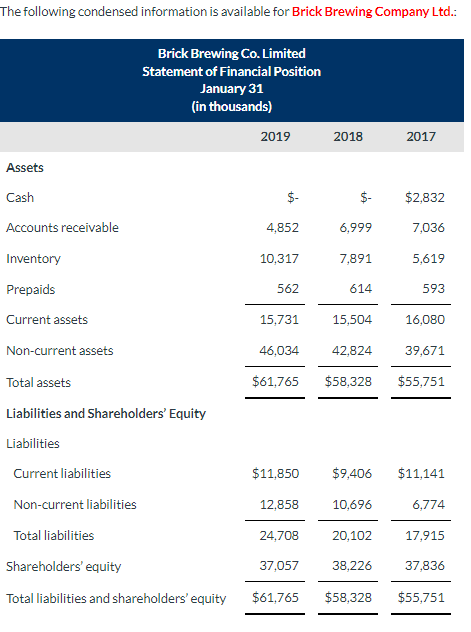
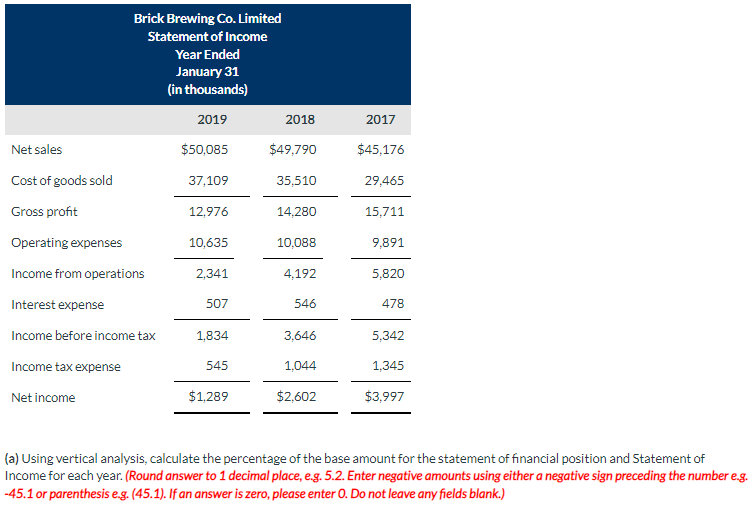
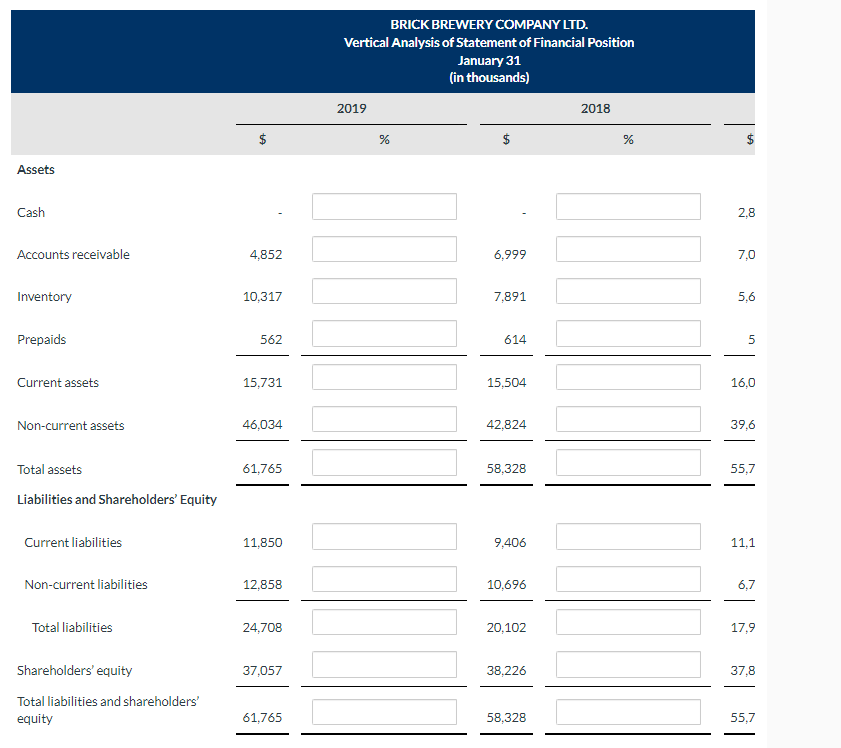
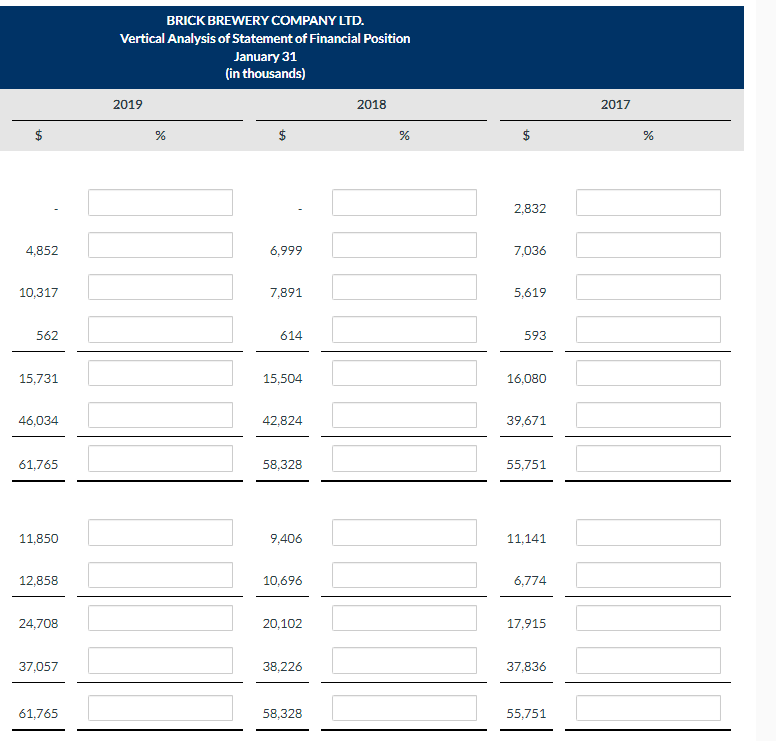
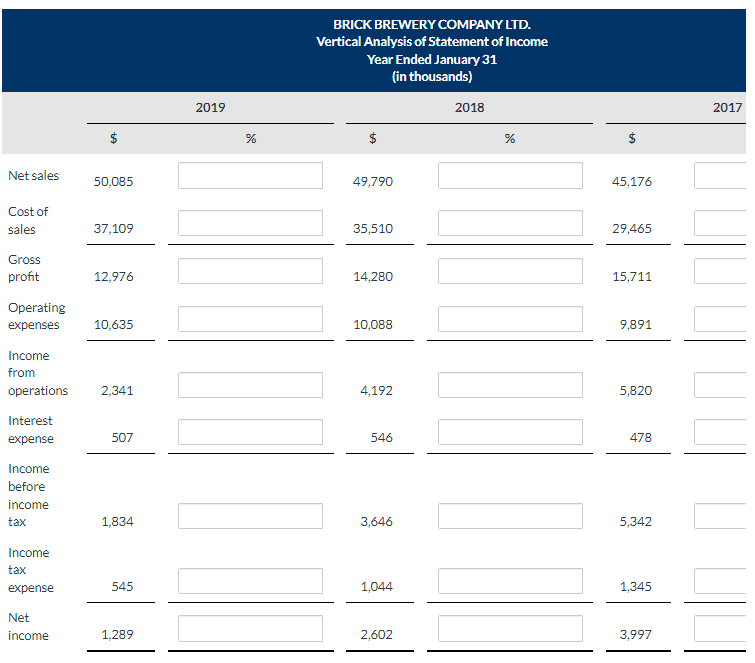
The following condensed information is available for Brick Brewing Company Ltd.: Brick Brewing Co. Limited Statement of Financial Position January 31 (in thousands) 2019 2018 2017 Assets Cash $2,832 Accounts receivable 4,852 6,999 7,036 Inventory 10,317 7,891 5,619 Prepaids 562 614 593 Current assets 15,731 15,504 16,080 Non-current assets 46,034 42,824 39,671 Total assets $61,765 $58,328 $55,751 Liabilities and Shareholders' Equity Liabilities Current liabilities $11,850 $9,406 $11,141 Non-current liabilities 12,858 10,696 6,774 Total liabilities 24,708 20,102 17,915 Shareholders' equity 37,057 38,226 37,836 Total liabilities and shareholders' equity $61,765 $58,328 $55,751 Brick Brewing Co. Limited Statement of Income Year Ended January 31 (in thousands) 2019 2018 2017 Net sales $50,085 $49,790 $45,176 Cost of goods sold 37,109 35,510 29,465 Gross profit 12,976 14,280 15,711 Operating expenses 10,635 10,088 9,891 Income from operations 2,341 4,192 5,820 Interest expense 507 546 478 Income before income tax 1,834 3,646 5,342 Income tax expense 545 1,044 1,345 Net income $1,289 $2,602 $3,997 (a) Using vertical analysis, calculate the percentage of the base amount for the statement of financial position and Statement of Income for each year. (Round answer to 1 decimal place, e.g. 5.2. Enter negative amounts using either a negative sign preceding the number e.g. -45.1 or parenthesis e.g. (45.1). If an answer is zero, please enter O. Do not leave any fields blank.) Assets Cash Accounts receivable 4,852 Inventory 10,317 Prepaids Current assets Non-current assets BRICK BREWERY COMPANY LTD. Vertical Analysis of Statement of Financial Position January 31 (in thousands) 2019 2018 % $ % $ 6,999 2,8 7,0 7,891 5,6 562 614 5 15,731 15,504 16,0 46,034 42,824 39,6 Total assets 61,765 58,328 55,7 Liabilities and Shareholders' Equity Current liabilities 11,850 9,406 11,1 Non-current liabilities 12,858 10,696 6,7 Total liabilities 24,708 20,102 17,9 Shareholders' equity 37,057 38,226 37,8 Total liabilities and shareholders' equity 61,765 58,328 55,7 BRICK BREWERY COMPANY LTD. Vertical Analysis of Statement of Financial Position January 31 (in thousands) 2019 2018 +A $ % $ % 4,852 10,317 562 6,999 2,832 7,036 7,891 5,619 614 593 15,731 15,504 16,080 46,034 42,824 39,671 61,765 58,328 55,751 11,850 9,406 11,141 12,858 10,696 6,774 24,708 20,102 17,915 37,057 38,226 37,836 61,765 58,328 55,751 2017 % 2019 BRICK BREWERY COMPANY LTD. Vertical Analysis of Statement of Income Year Ended January 31 (in thousands) % $ 2018 % Net sales 50,085 49.790 45,176 Cost of sales 37,109 35,510 29,465 Gross profit 12,976 14,280 15,711 Operating expenses 10,635 10,088 9,891 Income from operations 2,341 4,192 5,820 Interest expense 507 546 478 Income before income tax 1,834 3,646 5,342 Income tax expense 545 1,044 1,345 Net income 1,289 2,602 3,997 2017
Step by Step Solution
There are 3 Steps involved in it
Step: 1
To calculate the vertical analysis percentage for each item on the Statement of Financial Position a...
Get Instant Access to Expert-Tailored Solutions
See step-by-step solutions with expert insights and AI powered tools for academic success
Step: 2

Step: 3

Ace Your Homework with AI
Get the answers you need in no time with our AI-driven, step-by-step assistance
Get Started


