

Answered step by step
Verified Expert Solution
Question
1 Approved Answer
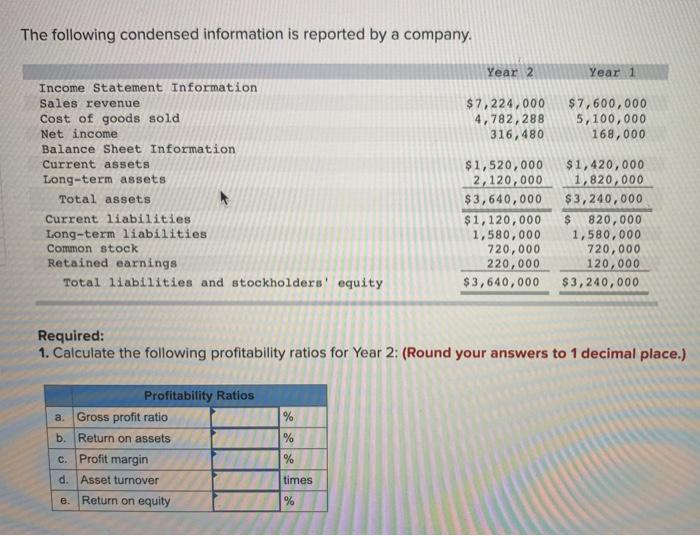
The following condensed information is reported by a company. Year 2 Year 1 $7,224,000 4,782,288 316,480 $7,600,000 5,100,000 168,000 Income Statement Information Sales revenue Cost
Step by Step Solution
There are 3 Steps involved in it
Step: 1

Get Instant Access to Expert-Tailored Solutions
See step-by-step solutions with expert insights and AI powered tools for academic success
Step: 2

Step: 3
Ace Your Homework with AI
Get the answers you need in no time with our AI-driven, step-by-step assistance
Get Started
Justified The Story Of Americas Audit
Authors: Dr. Kelli Ward
1st Edition
195725503X, 978-1957255033