Answered step by step
Verified Expert Solution
Link Copied!

Question

1 Approved Answer

The following cost graphs illustrate various types of cost behaviors. Groph 3 Groph 1 Graph 2 0 Activity Bose 0 Activity Bose Activity Bose Groph

The following cost graphs illustrate various types of cost behaviors. image text in transcribed

Groph 3 Groph 1 Graph 2 0 Activity Bose 0 Activity Bose Activity Bose Groph 4 Groph 5 Activity Base Activity Bose For each of the following costs, identify the cost graph that best describes its cost behavior as the number of units produced and sold increases. a. Per-unit cost of direct labor b. Rent on warehouse of S10,000 per month c. Insurance costs of $2,500 per month d. Sales commissions of $5,000 plus $0.05 for each item sold e. Total salaries of quality control supervisors. One supervisor must be added for each additional work shift Total employer pension costs of S0.30 per direct labor hour Per-unit straight-line depreciation costs Per-unit cost of direct materials f g. i. Total direct materials cost j Electricity costs of $5,000 per month plus SO.0004 per kilowatt-hour k. Per-unit cost of plant superintendent's salary Straight-line depreciation on factory equipment m. Repairs and maintenance costs of S3,000 for each 2,000 hours of factory machine usage n Total direct labor cost

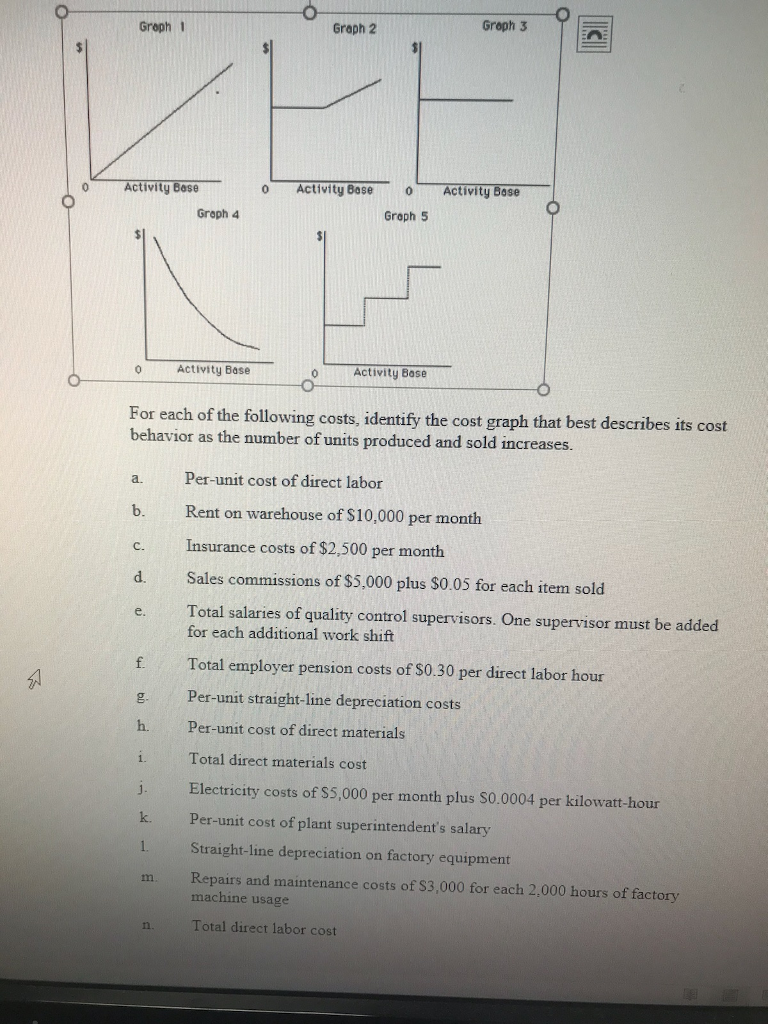
Step by Step Solution

There are 3 Steps involved in it

Step: 1

blur-text-image

Get Instant Access to Expert-Tailored Solutions

See step-by-step solutions with expert insights and AI powered tools for academic success

Step: 2

blur-text-image

Step: 3

blur-text-image

Ace Your Homework with AI

Get the answers you need in no time with our AI-driven, step-by-step assistance

Get Started

Recommended Textbook for

The Internet Market Research Audit

Authors: Cambridge

1st Edition

1902433742, 978-1902433745

More Books

Students also viewed these Accounting questions