Answered step by step
Verified Expert Solution
Question
1 Approved Answer
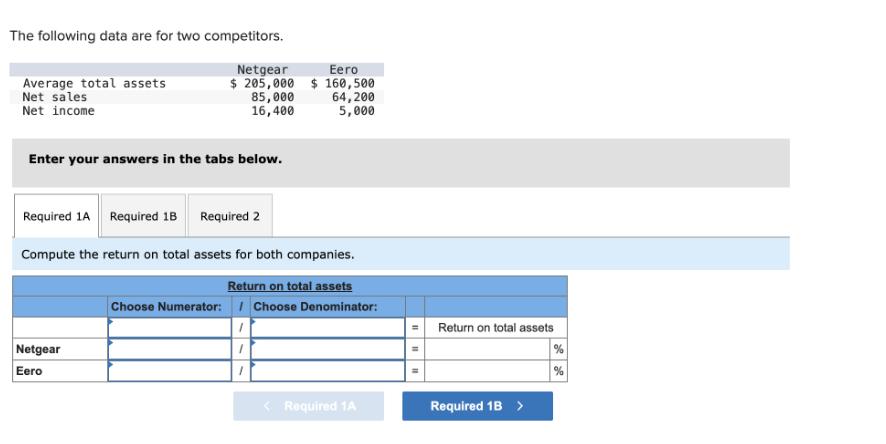
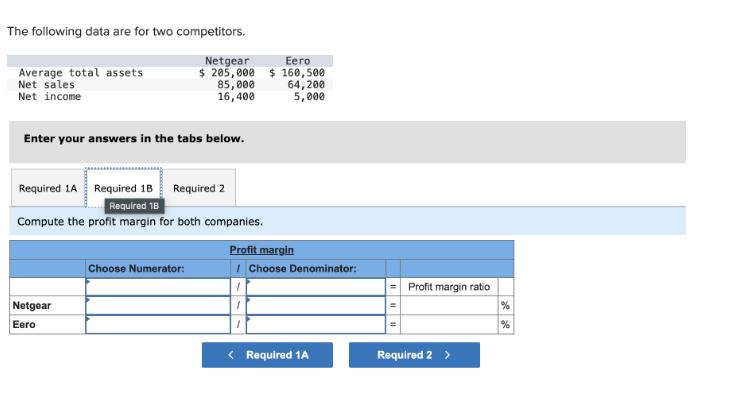
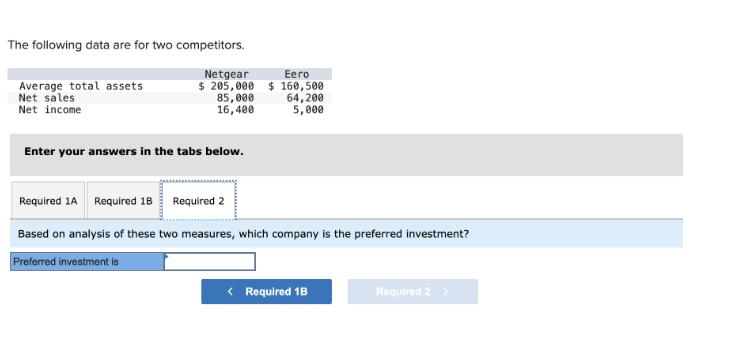
The following data are for two competitors. Average total assets Net sales Net income Eero Netgear $ 205,000 $ 160,500 85,000 16,400 64,200 5,000


The following data are for two competitors. Average total assets Net sales Net income Eero Netgear $ 205,000 $ 160,500 85,000 16,400 64,200 5,000 Enter your answers in the tabs below. Required 1A Required 1B Required 2 Compute the return on total assets for both companies. Return on total assets Choose Numerator: Choose Denominator: Netgear Eero 1 1 1 < Required 1A 11 Return on total assets Required 1B > de de % % The following data are for two competitors. Average total assets Net sales Net income Netgear Eero $ 205,000 $ 160,500 64,200 5,000 Enter your answers in the tabs below. Netgear Eero 85,000 16,400 Required 1A Required 1B Required 2 Required 18 Compute the profit margin for both companies. Choose Numerator: Profit margin Choose Denominator: < Required 1A 11 Profit margin ratio Required 2 > % % The following data are for two competitors. Average total assets Net sales Net income Netgear Eero $ 205,000 $ 160,500 85,000 16,400 Enter your answers in the tabs below. Required 1A Required 1B Required 2 64,200 5,000 Based on analysis of these two measures, which company is the preferred investment? Preferred investment is < Required 1B Required 22
Step by Step Solution
★★★★★
3.47 Rating (150 Votes )
There are 3 Steps involved in it
Step: 1
Based on the given financial data Netgear Eero has higher net income 16400 vs 5000 ...
Get Instant Access to Expert-Tailored Solutions
See step-by-step solutions with expert insights and AI powered tools for academic success
Step: 2

Step: 3

Ace Your Homework with AI
Get the answers you need in no time with our AI-driven, step-by-step assistance
Get Started


