Question
The following data are test results (in percent) of 20 epidemiology students: 85, 83, 91, 90, 88, 72, 98, 77, 60, 80, 88, 89,

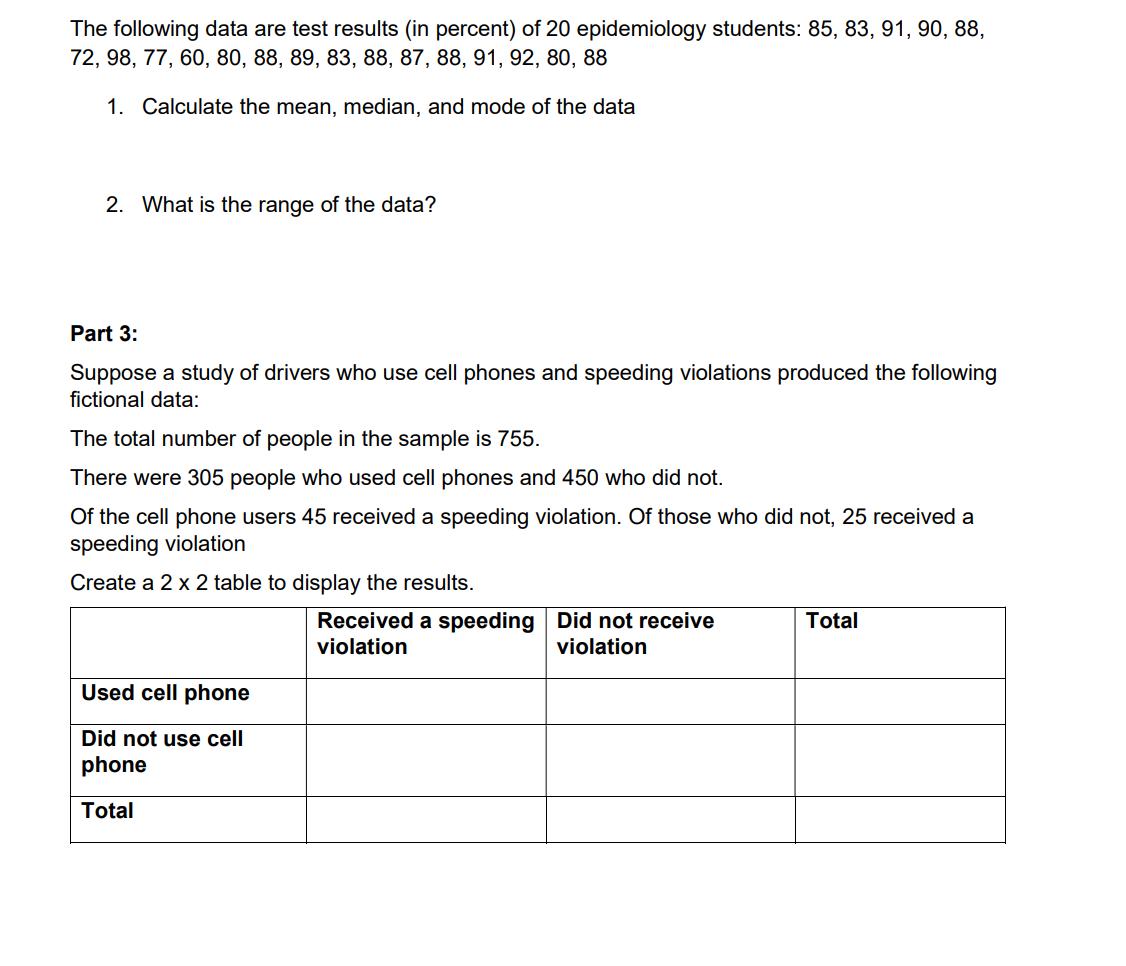
The following data are test results (in percent) of 20 epidemiology students: 85, 83, 91, 90, 88, 72, 98, 77, 60, 80, 88, 89, 83, 88, 87, 88, 91, 92, 80, 88 1. Calculate the mean, median, and mode of the data 2. What is the range of the data? Part 3: Suppose a study of drivers who use cell phones and speeding violations produced the following fictional data: The total number of people in the sample is 755. There were 305 people who used cell phones and 450 who did not. Of the cell phone users 45 received a speeding violation. Of those who did not, 25 received a speeding violation Create a 2 x 2 table to display the results. Received a speeding Did not receive violation violation Total Used cell phone Did not use cell phone Total
Step by Step Solution
There are 3 Steps involved in it
Step: 1

Get Instant Access to Expert-Tailored Solutions
See step-by-step solutions with expert insights and AI powered tools for academic success
Step: 2

Step: 3

Ace Your Homework with AI
Get the answers you need in no time with our AI-driven, step-by-step assistance
Get StartedRecommended Textbook for
Complete Business Statistics
Authors: Amir Aczel, Jayavel Sounderpandian
7th Edition
9780071077903, 73373605, 71077901, 9780073373607, 77239695, 978-0077239695
Students also viewed these Mathematics questions
Question
Answered: 1 week ago
Question
Answered: 1 week ago
Question
Answered: 1 week ago
Question
Answered: 1 week ago
Question
Answered: 1 week ago
Question
Answered: 1 week ago
Question
Answered: 1 week ago
Question
Answered: 1 week ago
Question
Answered: 1 week ago
Question
Answered: 1 week ago
Question
Answered: 1 week ago
Question
Answered: 1 week ago
Question
Answered: 1 week ago
Question
Answered: 1 week ago
Question
Answered: 1 week ago
Question
Answered: 1 week ago
Question
Answered: 1 week ago
Question
Answered: 1 week ago
Question
Answered: 1 week ago
Question
Answered: 1 week ago
Question
Answered: 1 week ago
Question
Answered: 1 week ago
View Answer in SolutionInn App


