Answered step by step
Verified Expert Solution
Question
1 Approved Answer
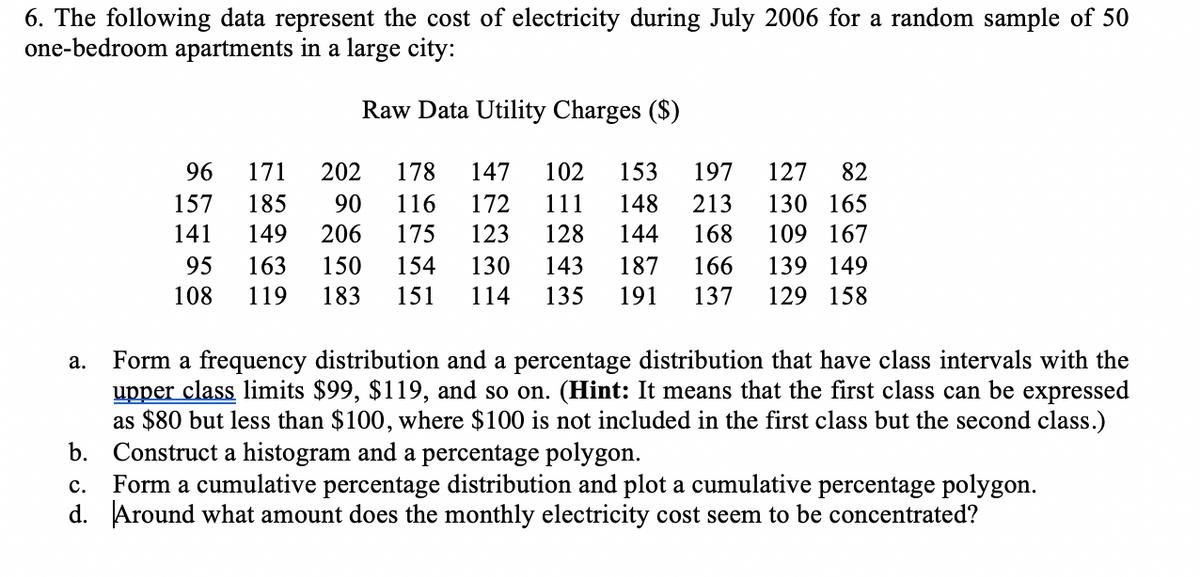
6. The following data represent the cost of electricity during July 2006 for a random sample of 50 one-bedroom apartments in a large city:

6. The following data represent the cost of electricity during July 2006 for a random sample of 50 one-bedroom apartments in a large city: Raw Data Utility Charges ($) 96 171 202 178 147 102 153 197 127 82 157 185 90 116 172 111 148 213 130 165 141 149 206 175 123 128 144 168 109 167 95 163 150 154 130 143 187 166 139 149 108 119 183 151 114 135 191 137 129 158 Form a frequency distribution and a percentage distribution that have class intervals with the upper class limits $99, $119, and so on. (Hint: It means that the first class can be expressed as $80 but less than $100, where $100 is not included in the first class but the second class.) b. Construct a histogram and a percentage polygon. c. Form a cumulative percentage distribution and plot a cumulative percentage polygon. d. Around what amount does the monthly electricity cost seem to be concentrated? .
Step by Step Solution
★★★★★
3.48 Rating (151 Votes )
There are 3 Steps involved in it
Step: 1
a Frequency and Percentage Distribution table Class interval Frequency percentage Cumulative ...
Get Instant Access to Expert-Tailored Solutions
See step-by-step solutions with expert insights and AI powered tools for academic success
Step: 2

Step: 3

Ace Your Homework with AI
Get the answers you need in no time with our AI-driven, step-by-step assistance
Get Started


