Answered step by step
Verified Expert Solution
Question
1 Approved Answer
A sample of elderly people were given a psychiatric examination to determine whether symptoms of senility were present (Y= 1 if symptoms present, Y

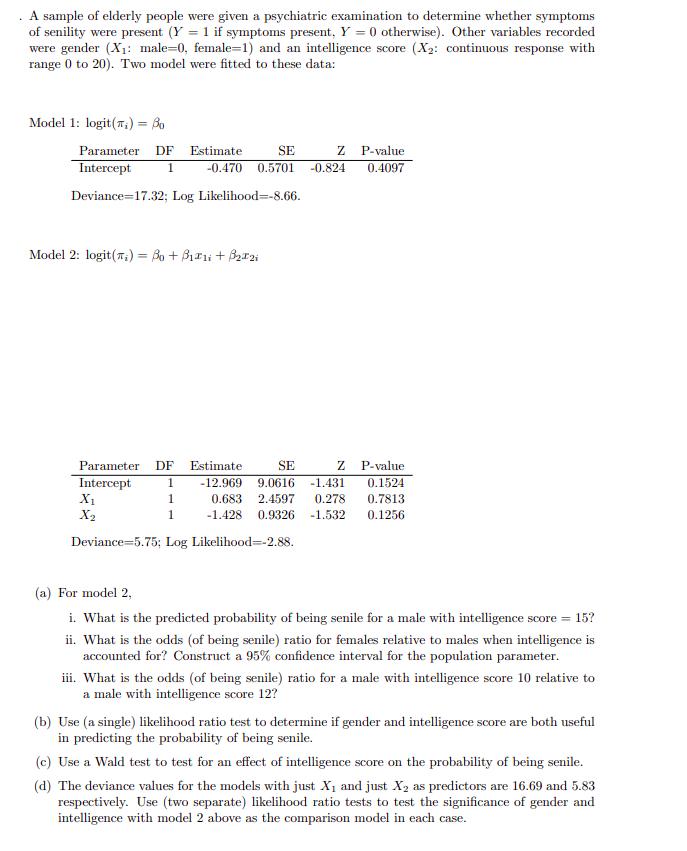
A sample of elderly people were given a psychiatric examination to determine whether symptoms of senility were present (Y= 1 if symptoms present, Y = 0 otherwise). Other variables recorded were gender (X: male-0, female-1) and an intelligence score (X: continuous response with range 0 to 20). Two model were fitted to these data: Model 1: logit () = Bo Parameter DF Intercept 1 Deviance 17.32; Log Likelihood -8.66. Parameter DF Intercept 1 1 1 Estimate Model 2: logit () = Bo + B2i +2i X X SE Z -0.470 0.5701 -0.824 SE Estimate Z -12.969 9.0616 -1.431 0.683 2.4597 0.278 -1.428 0.9326 -1.532 Deviance-5.75; Log Likelihood -2.88. P-value 0.4097 P-value 0.1524 0.7813 0.1256 (a) For model 2, i. What is the predicted probability of being senile for a male with intelligence score = 15? ii. What is the odds (of being senile) ratio for females relative to males when intelligence is accounted for? Construct a 95% confidence interval for the population parameter. iii. What is the odds (of being senile) ratio for a male with intelligence score 10 relative to a male with intelligence score 12? (b) Use (a single) likelihood ratio test to determine if gender and intelligence score are both useful in predicting the probability of being senile. (c) Use a Wald test to test for an effect of intelligence score on the probability of being senile. (d) The deviance values for the models with just X and just X as predictors are 16.69 and 5.83 respectively. Use (two separate) likelihood ratio tests to test the significance of gender and intelligence with model 2 above as the comparison model in each case.
Step by Step Solution
★★★★★
3.39 Rating (152 Votes )
There are 3 Steps involved in it
Step: 1
The image contains a statistical analysis output from a logistic regression model along with several questions related to the analysis Lets start with ...
Get Instant Access to Expert-Tailored Solutions
See step-by-step solutions with expert insights and AI powered tools for academic success
Step: 2

Step: 3

Ace Your Homework with AI
Get the answers you need in no time with our AI-driven, step-by-step assistance
Get Started


