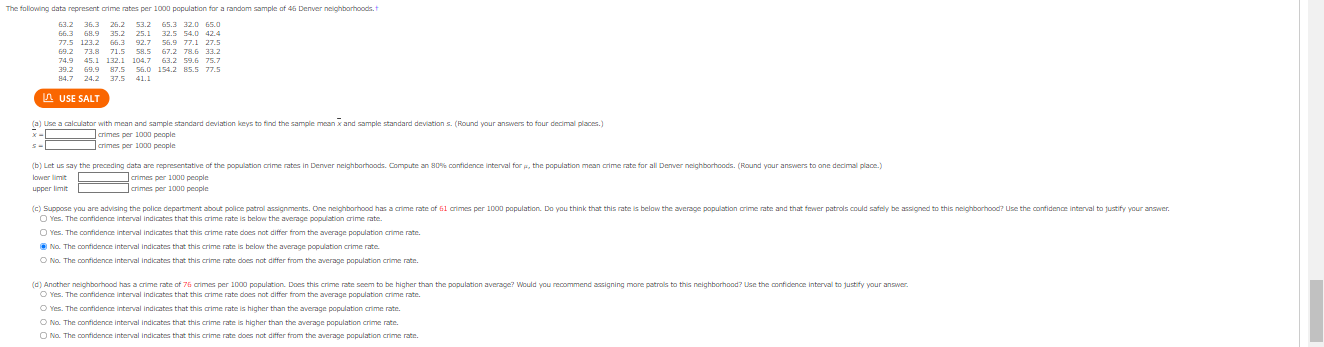
The following data represent crime rates per 1000 population for a random sample of 46 Denver ne 63.2 36.3 26.2 53.2 65.3 32.0 65.0 6G.3
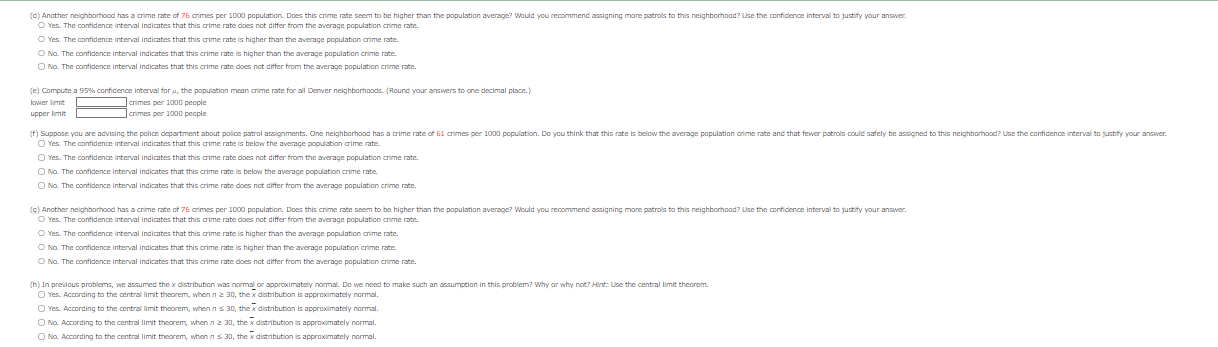
The following data represent crime rates per 1000 population for a random sample of 46 Denver ne 63.2 36.3 26.2 53.2 65.3 32.0 65.0 6G.3 68.9 35.2 25.1 32.5 54.0 42.4 77.5 123.2 66.3 92.7 56.9 77.1 27.5 69.2 73.8 71.5 5 67.2 78.6 33.2 74.9 45.1 132.1 104.7 63.2 59.6 75.7 Z'GE 69.9 87.5 56.0 154.2 85.5 77.5 84.7 24.2 37.5 41.1 LOL USE SALT (3) Use a clolator with mean and sample standard deviation keys to find the sample mean x and sample standard deviation s. (Round your answers to four decimal places.) x - s per 1000 people S - crimes per 1000 people (b) Let us say the preceding data are representative of the population crime rates In Denver neighborhoods. Compute an 80%% confidence Interval for a, the population mean crime rate for all Denver neighborhoods. (Round your answers to one decimal place.) lower limit crimes per 1000 people upper limit crimes per 1000 people (c) Suppose you are advising the police depart orhood has a crime rate of 61 crimes per 1000 population. Do you think that this rate is below the average population crime rate and that fewer patrols could safely be assigned to this neighborhood? Use the confidence interval to justify your answer. O Yes. The confidence interval indicates that this ulation crime rate. O Yes. The confidence interval indicates he average population crime rate. No. The confidence interval indicates that this rage population crime rate. No. The confidence Interval Indicates that this cr pes not differ from the average population crime rate. (d) Another neighborhood has a crime rate of 7 per 1000 population. Does this crime rate seem to be higher than the population nice interval to justify your answer. Yes. The confidence interval indicates that this crin or from the average population crime rate. Yes. The confiden on crime rate. No. The confide ation crime rate. tion crime rate.(d) Another neighborhood has a crime rate of 76 crimes per 1000 population. Does this crime rate seem to be higher than the population average? Would you recommend a patrols to this neighborhood? Use the confidence Interval to justify your answer. Yes. The confidence Interval Indicates that this crime rate does not differ from the average population crime rate. O Yes. The confidence Interval indicates that this opulation crime rate. No. The confidence interval Indicates that this crime rate is higher than the average population crime rate. O No. The confidence interval indicates that this crime rate does not differ from the average population crime rate. (e] Compute a 95% confidence Interval for u, the population mean crime rate for all Denver neighborhoods. (Round your answers to one decimal place.) lower limit crimes per 1000 people upper limit crimes per 1000 people ") Suppose you are advising the police department about police patrol assignments. One neighborhood has a crime rate of 61 crimes per 1000 population. Do you think that this rate is below the average population crime rate and that fewer patrols could safely be assigned to this neighborhood? Use the confidence interval to justify your answer. O Yes. The confidence Interval Indicates that this crime rate is below stion crime rate. O Yes. The confidence Interval indicates that this crime rate does not differ from the average population crime rate. O No. The confidence interval Indicates that this crime rate is below the average population crime rate. O No. The confidence interval Indicates that this crime rate does not differ from the average population crime rate. (g) Another neighborhood has a crime rate of 76 crimes per 1000 population. Does this crime rate seem to be higher than the population average? Would you recommend assigning m more patrols to this neighborhood? Use the confidence interval to justify your answer. Yes. The confidence Interval indicates that this crime rate does not differ from the average population crime rate. Yes. The confidence interval Indicates that this crime rate is higher than the average population crime rate. No. The confidence Interval Indicates that this crime rate is higher than the average population crime rate. O No. The confidence Interval Indicates that this crime rate does not differ from the average population crime rate. (h) In previous problems, we assumed the x oximately normal. Do we need to make such an assumption in this problem? Why or why not? Hint: Use the central limit theorem. O Yes. According to the central limit the in is approximately normal. O Yes. According to the central limit the n n 5 30, the x distribution oximately normal. O No. According to the central limit the orem, when n 2 30, the x distribution ximately normal. No. According to the central limit theorem, when / 5 30, the x distribution is approximately normal
Step by Step Solution
There are 3 Steps involved in it
Step: 1
Get Instant Access to Expert-Tailored Solutions
See step-by-step solutions with expert insights and AI powered tools for academic success
Step: 2
Step: 3
Ace Your Homework with AI
Get the answers you need in no time with our AI-driven, step-by-step assistance