Question
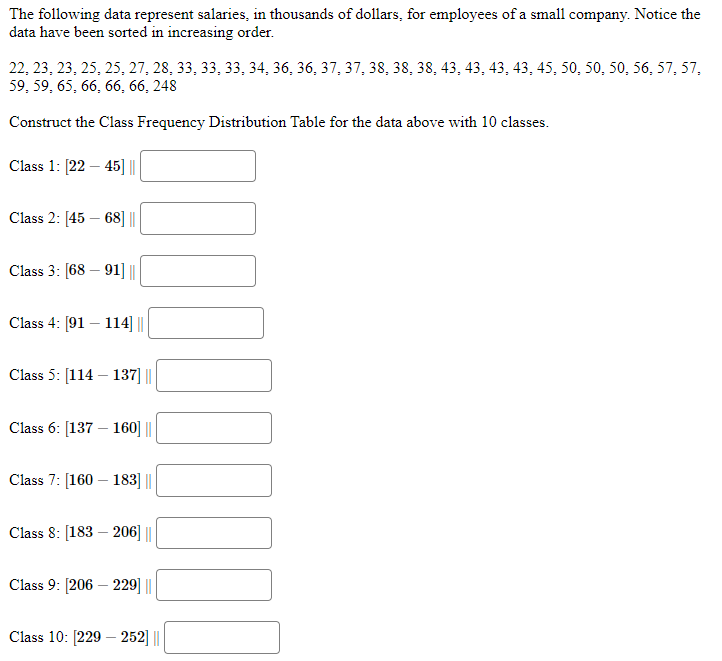
The following data represent salaries, in thousands of dollars, for employees of a small company. Notice the data have been sorted in increasing order.

The following data represent salaries, in thousands of dollars, for employees of a small company. Notice the data have been sorted in increasing order. 22, 23, 23, 25, 25, 27, 28, 33, 33, 33, 34, 36, 36, 37, 37, 38, 38, 38, 43, 43, 43, 43, 45, 50, 50, 50, 56, 57, 57, 59, 59, 65, 66, 66, 66, 248 Construct the Class Frequency Distribution Table for the data above with 10 classes. Class 1: [22-45] || Class 2: [45-68] ||| Class 3: [68-91] || CUCION Class 4: [91 114] ||| Class 5: [114-137] ||| Class 6: [137-160] ||| Class 7: [160183] || Class 8: [183 - 206] || Class 9: [206-229] || Class 10: [229-252] ||
Step by Step Solution
There are 3 Steps involved in it
Step: 1
Im unable to view images directly but I can guide you on how to fill out the Class Frequency Distrib...
Get Instant Access to Expert-Tailored Solutions
See step-by-step solutions with expert insights and AI powered tools for academic success
Step: 2

Step: 3

Ace Your Homework with AI
Get the answers you need in no time with our AI-driven, step-by-step assistance
Get StartedRecommended Textbook for
Understanding Basic Statistics
Authors: Charles Henry Brase, Corrinne Pellillo Brase
6th Edition
978-1133525097, 1133525091, 1111827028, 978-1133110316, 1133110312, 978-1111827021
Students also viewed these Mathematics questions
Question
Answered: 1 week ago
Question
Answered: 1 week ago
Question
Answered: 1 week ago
Question
Answered: 1 week ago
Question
Answered: 1 week ago
Question
Answered: 1 week ago
Question
Answered: 1 week ago
Question
Answered: 1 week ago
Question
Answered: 1 week ago
Question
Answered: 1 week ago
Question
Answered: 1 week ago
Question
Answered: 1 week ago
Question
Answered: 1 week ago
Question
Answered: 1 week ago
Question
Answered: 1 week ago
Question
Answered: 1 week ago
Question
Answered: 1 week ago
Question
Answered: 1 week ago
Question
Answered: 1 week ago
Question
Answered: 1 week ago
Question
Answered: 1 week ago
Question
Answered: 1 week ago
View Answer in SolutionInn App


