

Answered step by step
Verified Expert Solution
Question
1 Approved Answer
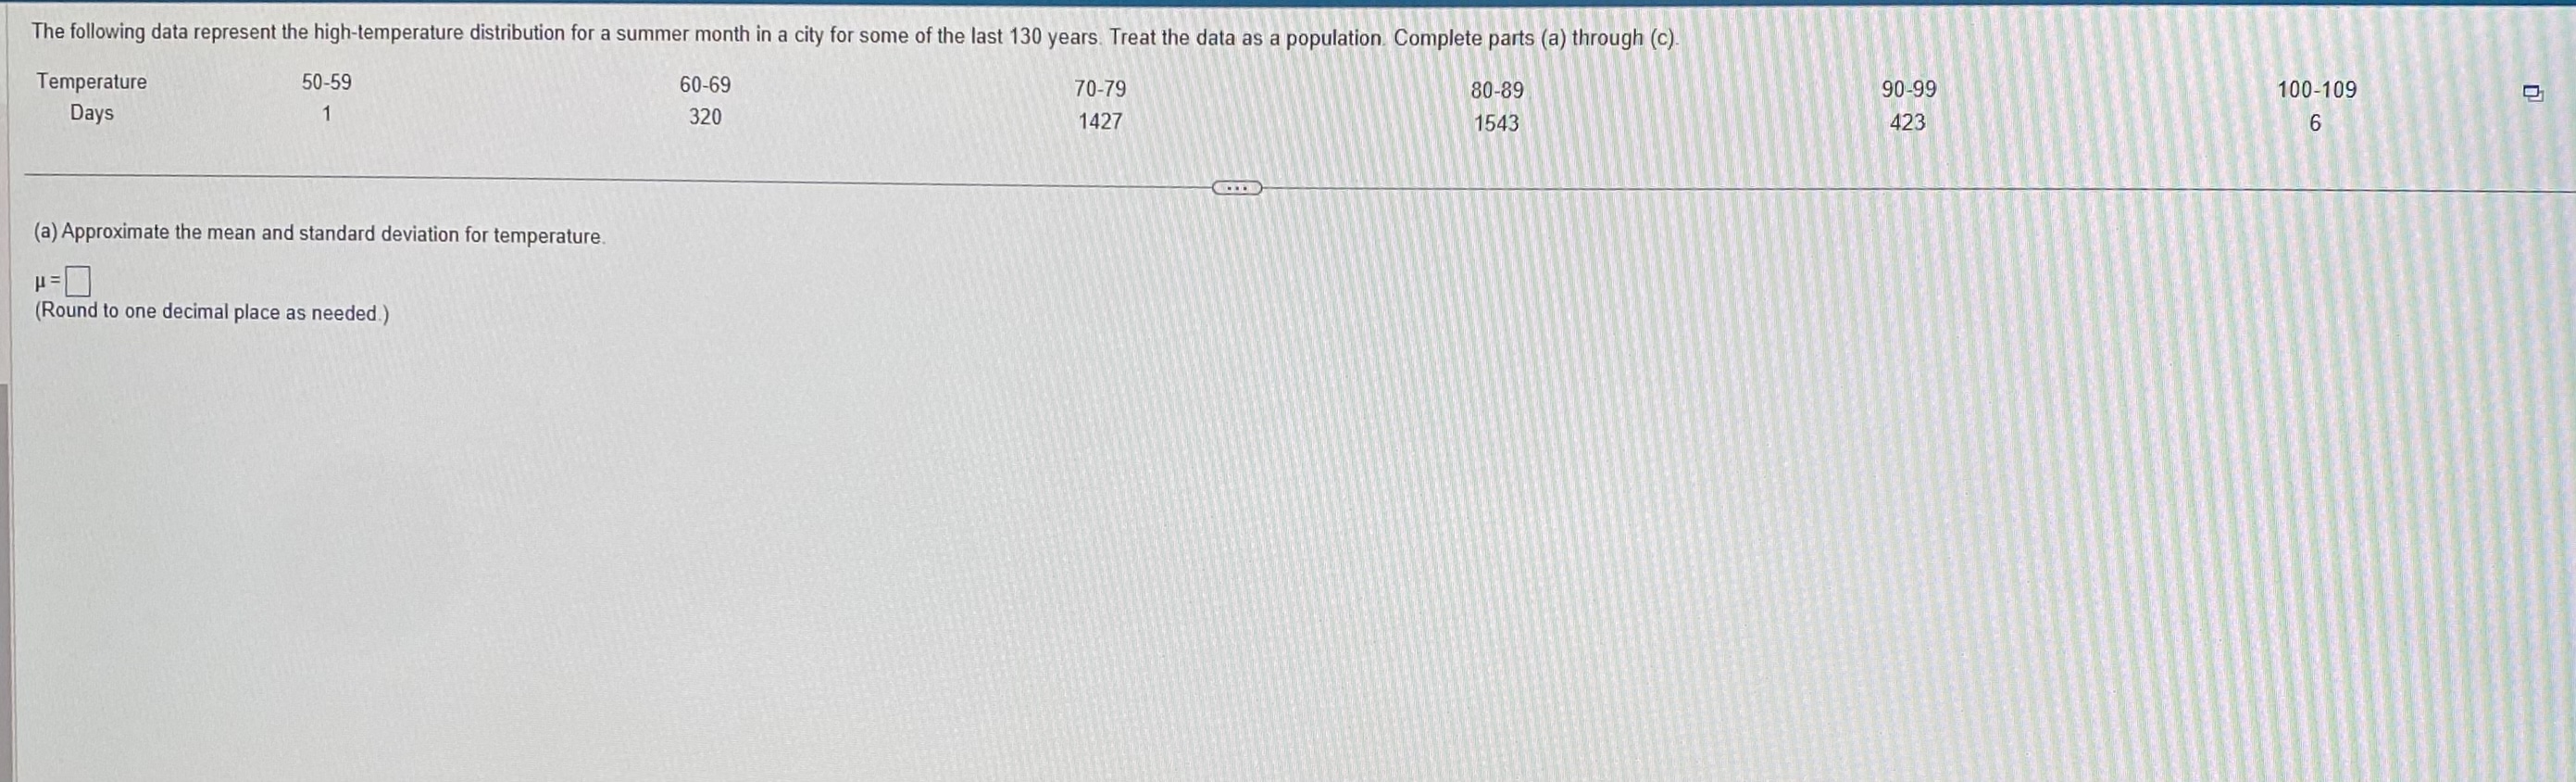
The following data represent the high-temperature distribution for a summer month in a city for some of the last 130 years. Treat the data as

Step by Step Solution
There are 3 Steps involved in it
Step: 1

Get Instant Access to Expert-Tailored Solutions
See step-by-step solutions with expert insights and AI powered tools for academic success
Step: 2

Step: 3
Ace Your Homework with AI
Get the answers you need in no time with our AI-driven, step-by-step assistance
Get Started
Elementary Differential Geometry
Authors: Christian Bar
1st Edition
051173123X, 9780511731235