Answered step by step
Verified Expert Solution
Question
1 Approved Answer
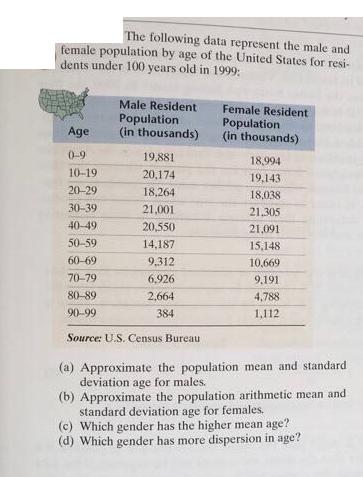
The following data represent the male and female population by age of the United States for resi- dents under 100 years old in 1999:

The following data represent the male and female population by age of the United States for resi- dents under 100 years old in 1999: Age 0-9 10-19 20-29 30-39 40-49 50-59 60-69 70-79 80-89 90-99 Male Resident Population (in thousands) 19,881 20,174 18,264 21,001 20,550 14,187 9,312 6,926 2,664 384 Source: U.S. Census Bureau Female Resident Population (in thousands) 18,994 19,143. 18,038 21.305 21,091 15,148 10,669 9,191 4,788 1.112 (a) Approximate the population mean and standard deviation age for males. (b) Approximate the population arithmetic mean and standard deviation age for females. (c) Which gender has the higher mean age? (d) Which gender has more dispersion in age?
Step by Step Solution
★★★★★
3.46 Rating (153 Votes )
There are 3 Steps involved in it
Step: 1
a For males Population Mean males Age Population Total Population Population Standard Deviation male...
Get Instant Access to Expert-Tailored Solutions
See step-by-step solutions with expert insights and AI powered tools for academic success
Step: 2

Step: 3

Ace Your Homework with AI
Get the answers you need in no time with our AI-driven, step-by-step assistance
Get Started


