Question
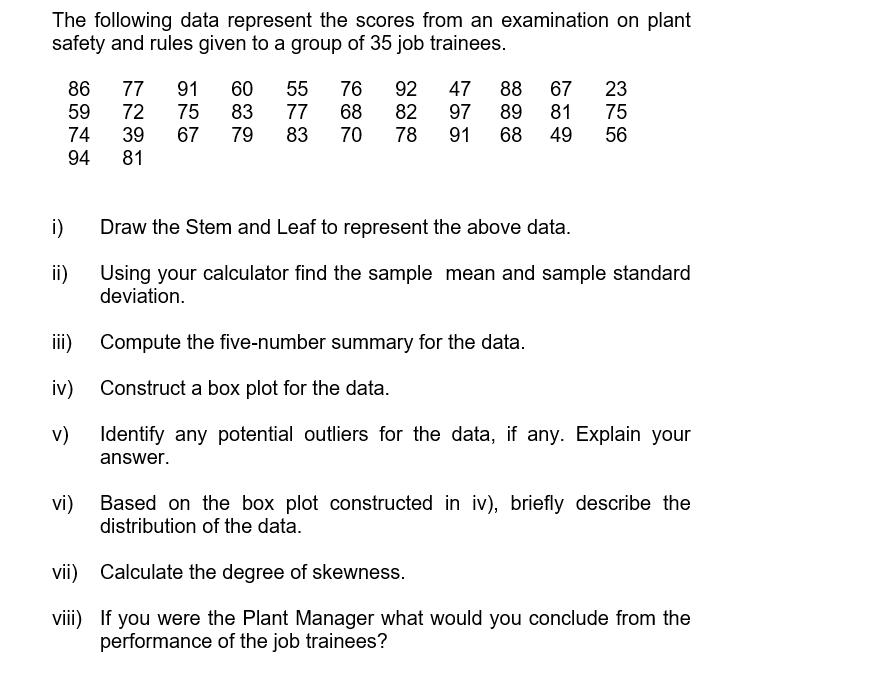
The following data represent the scores from an examination on plant safety and rules given to a group of 35 job trainees. i) ii)

The following data represent the scores from an examination on plant safety and rules given to a group of 35 job trainees. i) ii) 86 59 74 94 iii) iv) V) vi) 77 91 60 55 76 92 72 75 83 77 68 82 83 70 39 67 79 81 47 88 67 23 97 89 81 75 78 91 68 49 56 Draw the Stem and Leaf to represent the above data. Using your calculator find the sample mean and sample standard deviation. Compute the five-number summary for the data. Construct a box plot for the data. Identify any potential outliers for the data, if any. Explain your answer. Based on the box plot constructed in iv), briefly describe the distribution of the data. vii) Calculate the degree of skewness. viii) If you were the Plant Manager what would you conclude from the performance of the job trainees?
Step by Step Solution
3.40 Rating (163 Votes )
There are 3 Steps involved in it
Step: 1
Solution i 2 3 3 9 4 7 9 5 5 6 9 6 0 7 7 ...
Get Instant Access to Expert-Tailored Solutions
See step-by-step solutions with expert insights and AI powered tools for academic success
Step: 2

Step: 3

Ace Your Homework with AI
Get the answers you need in no time with our AI-driven, step-by-step assistance
Get StartedRecommended Textbook for
Probability & Statistics For Engineers & Scientists
Authors: Ronald E. Walpole, Raymond H. Myers, Sharon L. Myers, Keying
7th Edition
9789813131279, 130415294, 9813131276, 978-0130415295
Students also viewed these Chemical Engineering questions
Question
Answered: 1 week ago
Question
Answered: 1 week ago
Question
Answered: 1 week ago
Question
Answered: 1 week ago
Question
Answered: 1 week ago
Question
Answered: 1 week ago
Question
Answered: 1 week ago
Question
Answered: 1 week ago
Question
Answered: 1 week ago
Question
Answered: 1 week ago
Question
Answered: 1 week ago
Question
Answered: 1 week ago
Question
Answered: 1 week ago
Question
Answered: 1 week ago
Question
Answered: 1 week ago
Question
Answered: 1 week ago
Question
Answered: 1 week ago
Question
Answered: 1 week ago
Question
Answered: 1 week ago
Question
Answered: 1 week ago
Question
Answered: 1 week ago
Question
Answered: 1 week ago
Question
Answered: 1 week ago
View Answer in SolutionInn App


