

Answered step by step
Verified Expert Solution
Question
1 Approved Answer
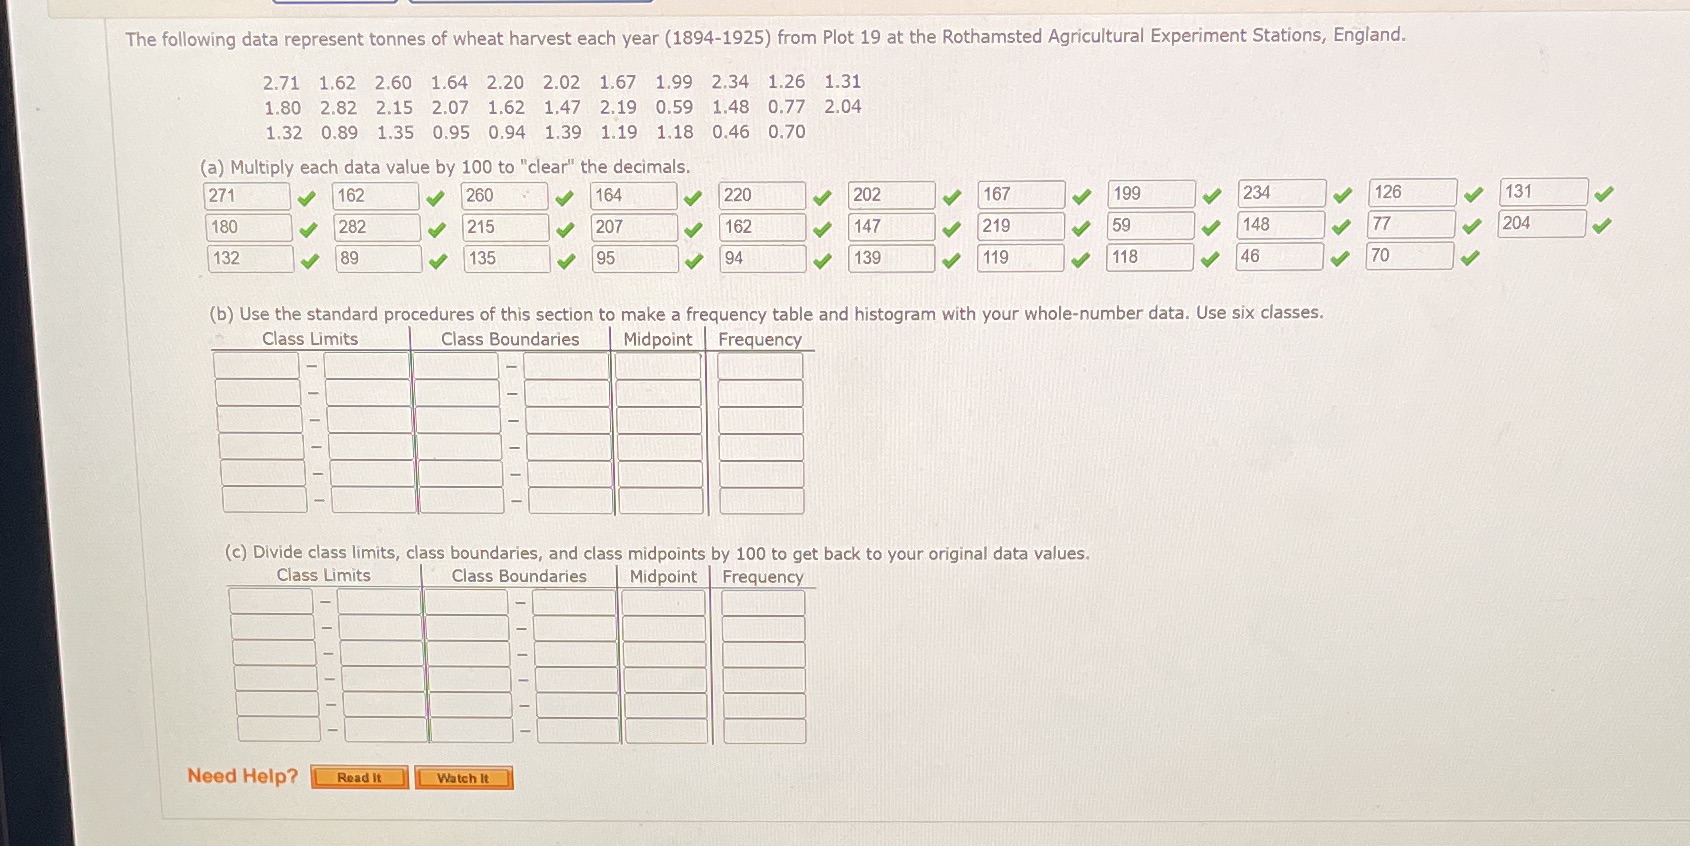
The following data represent tonnes of wheat harvest each year (1894-1925) from Plot 19 at the Rothamsted Agricultural Experiment Stations, England. 2.71 1.62 2.60 1.64
Step by Step Solution
There are 3 Steps involved in it
Step: 1

Get Instant Access to Expert-Tailored Solutions
See step-by-step solutions with expert insights and AI powered tools for academic success
Step: 2

Step: 3
Ace Your Homework with AI
Get the answers you need in no time with our AI-driven, step-by-step assistance
Get Started
Trigonometry A Unit Circle Approach
Authors: Michael Sullivan
10th Edition
0321999347, 9780321999344