

Answered step by step
Verified Expert Solution
Question
1 Approved Answer
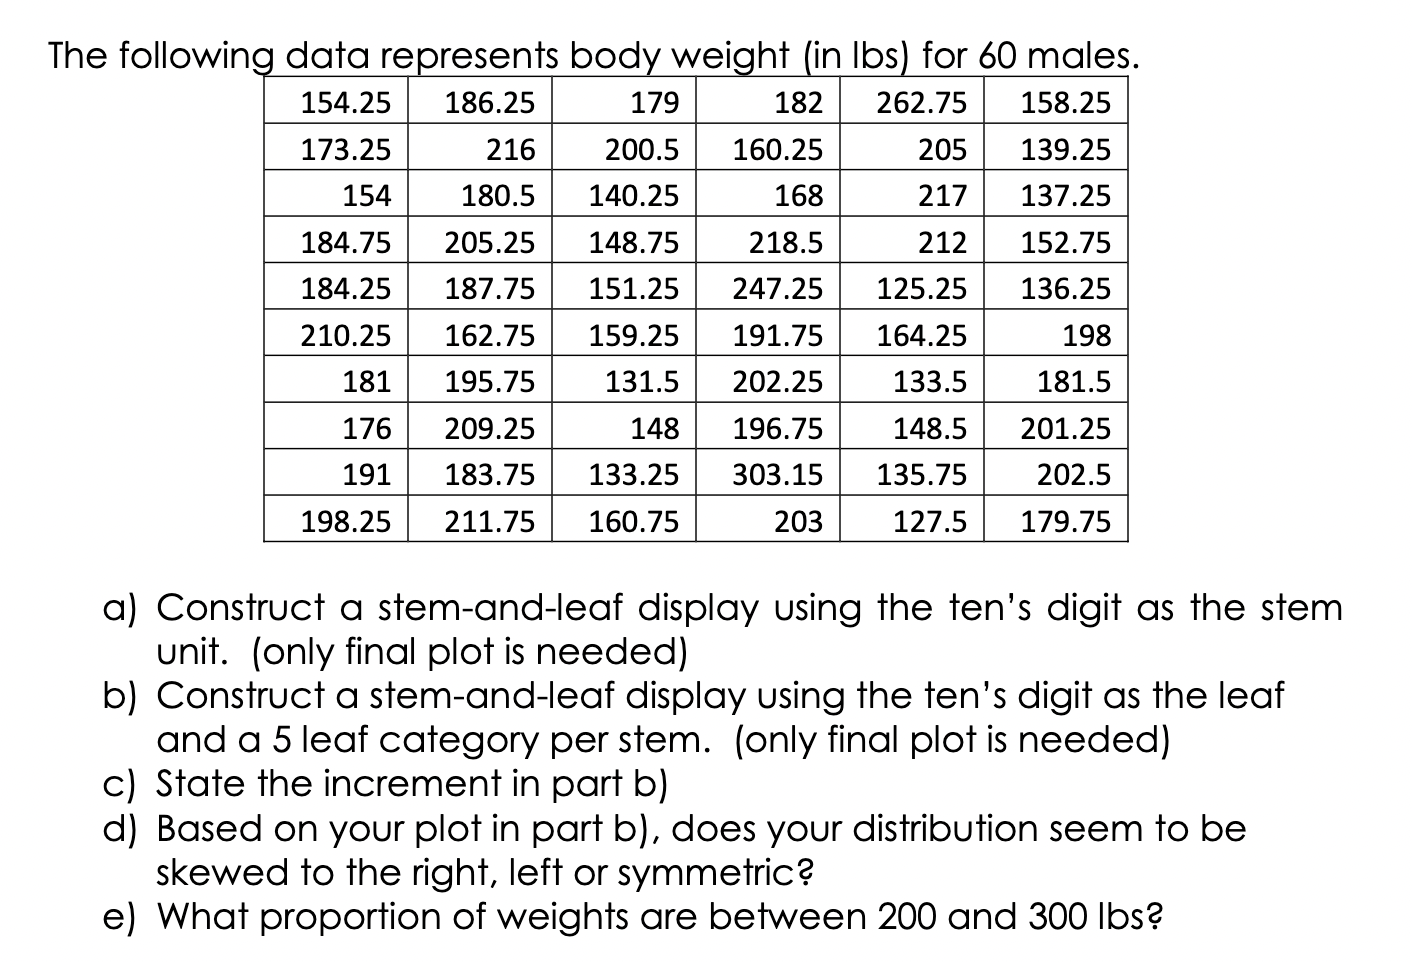
The following data represents body weight (in lbs) for 60 males. 154.25 186.25 179 182 262.75 158.25 173.25 216 200.5 160.25 205 139.25 154 180.5
Step by Step Solution
There are 3 Steps involved in it
Step: 1

Get Instant Access to Expert-Tailored Solutions
See step-by-step solutions with expert insights and AI powered tools for academic success
Step: 2

Step: 3
Ace Your Homework with AI
Get the answers you need in no time with our AI-driven, step-by-step assistance
Get Started
College Algebra Enhanced With Graphing Utilities (Subscription)
Authors: Michael Sullivan, Michael Sullivan III
6th Edition
0321849167, 9780321849168