

Question
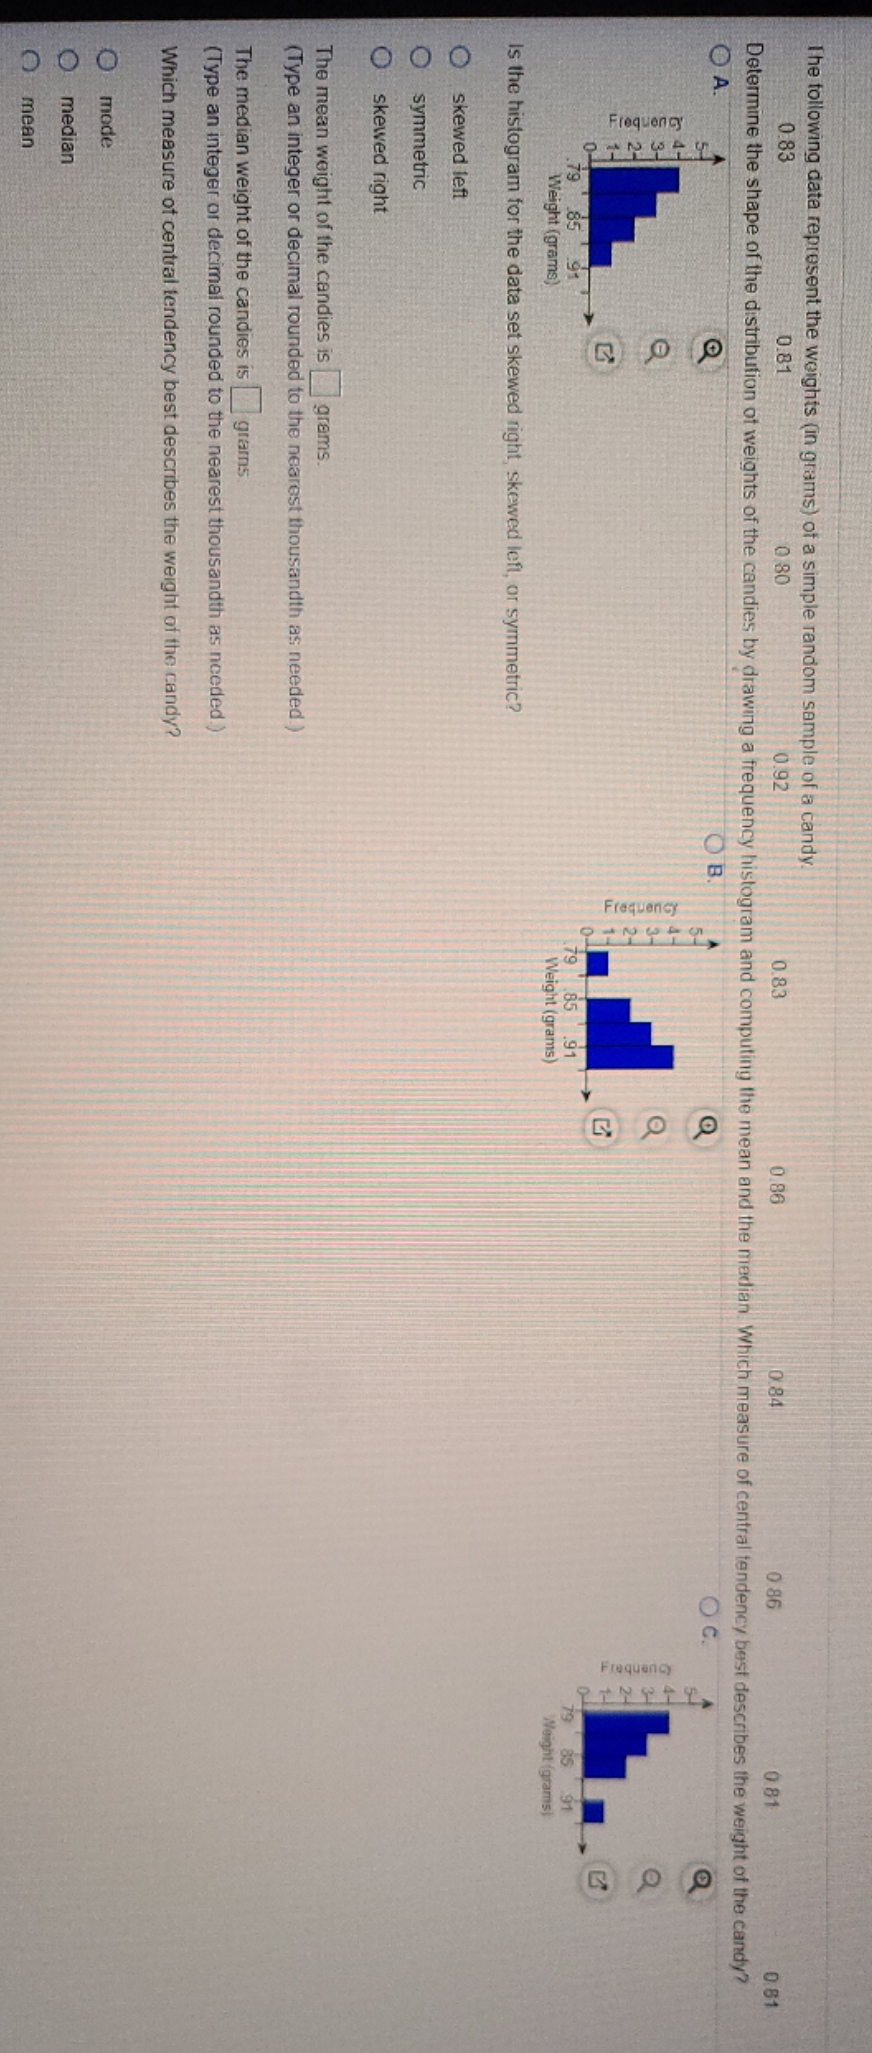
The following data represents the weights (in grams) of a simple random sample of candy 0.83 0.81 0.80 0.92 0.83 0.86 0.84 0.86 0.81 0.81
The following data represents the weights (in grams) of a simple random sample of candy 0.83 0.81 0.80 0.92 0.83 0.86 0.84 0.86 0.81 0.81 determined the shape of the distribution of weight of the candies by drawing a frequency histogram and computing the mean and the median. Which measurement of central tendency best describes the weight of the candy Choose the correct frequency histogram below.
Step by Step Solution
There are 3 Steps involved in it
Step: 1

Get Instant Access to Expert-Tailored Solutions
See step-by-step solutions with expert insights and AI powered tools for academic success
Step: 2

Step: 3
Ace Your Homework with AI
Get the answers you need in no time with our AI-driven, step-by-step assistance
Get Started
Introduction to Probability
Authors: Mark Daniel Ward, Ellen Gundlach
1st edition
716771098, 978-1319060893, 1319060897, 978-0716771098