Answered step by step
Verified Expert Solution
Question
1 Approved Answer
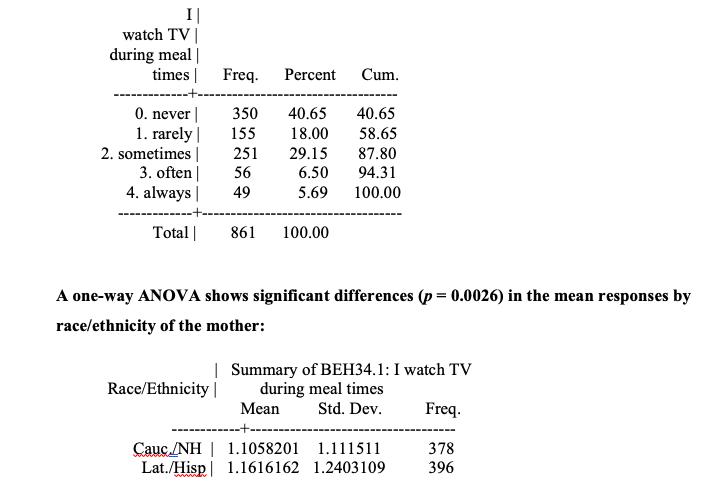
The following data show responses of 861 young mothers to the question, of whether they watched TV during mealtimes, with response categories as shown in
- The following data show responses of 861 young mothers to the question, of whether they watched TV during mealtimes, with response categories as shown in the table.


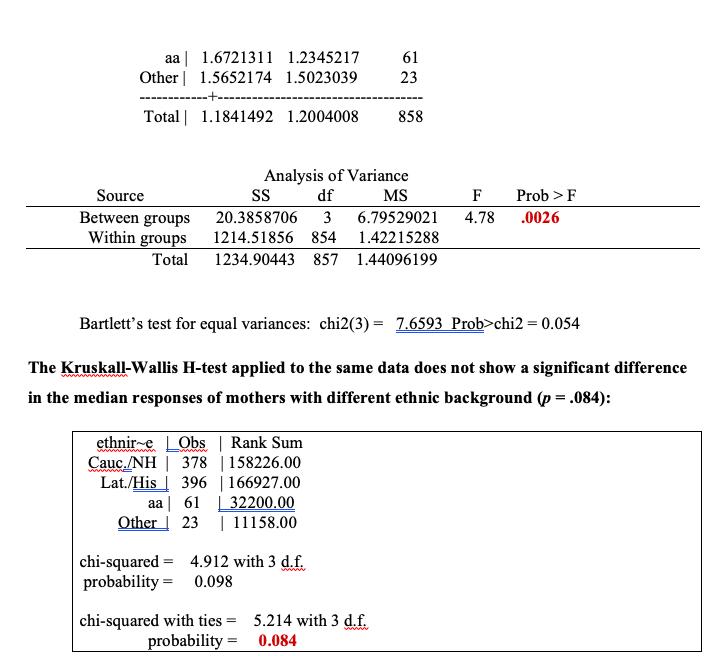
- Which result should we trust more? Why?
- Calculate the ‘expected” rank sums for each of the four ethnic groups in the Kruskal-Wallis H-test.
I| watch TV | during meal | times | 0. never | 1. rarely | 2. sometimes | 3. often | 4. always | Freq. 350 155 251 56 49 | Race/Ethnicity | Percent Cum. 40.65 18.00 29.15 6.50 5.69 Total | 861 100.00 40.65 58.65 87.80 94.31 100.00 A one-way ANOVA shows significant differences (p = 0.0026) in the mean responses by race/ethnicity of the mother: Summary of BEH34.1: I watch TV during meal times Mean Std. Dev. ---------- Cauc/NH | 1.1058201 1.111511 Lat./Hisp 1.1616162 1.2403109 Freq. 378 396
Step by Step Solution
★★★★★
3.45 Rating (164 Votes )
There are 3 Steps involved in it
Step: 1
Which result should we trust more Why The ANOVA result should be trusted more because the KruskallWallis Htest does not take into account the differen...
Get Instant Access to Expert-Tailored Solutions
See step-by-step solutions with expert insights and AI powered tools for academic success
Step: 2

Step: 3

Ace Your Homework with AI
Get the answers you need in no time with our AI-driven, step-by-step assistance
Get Started


