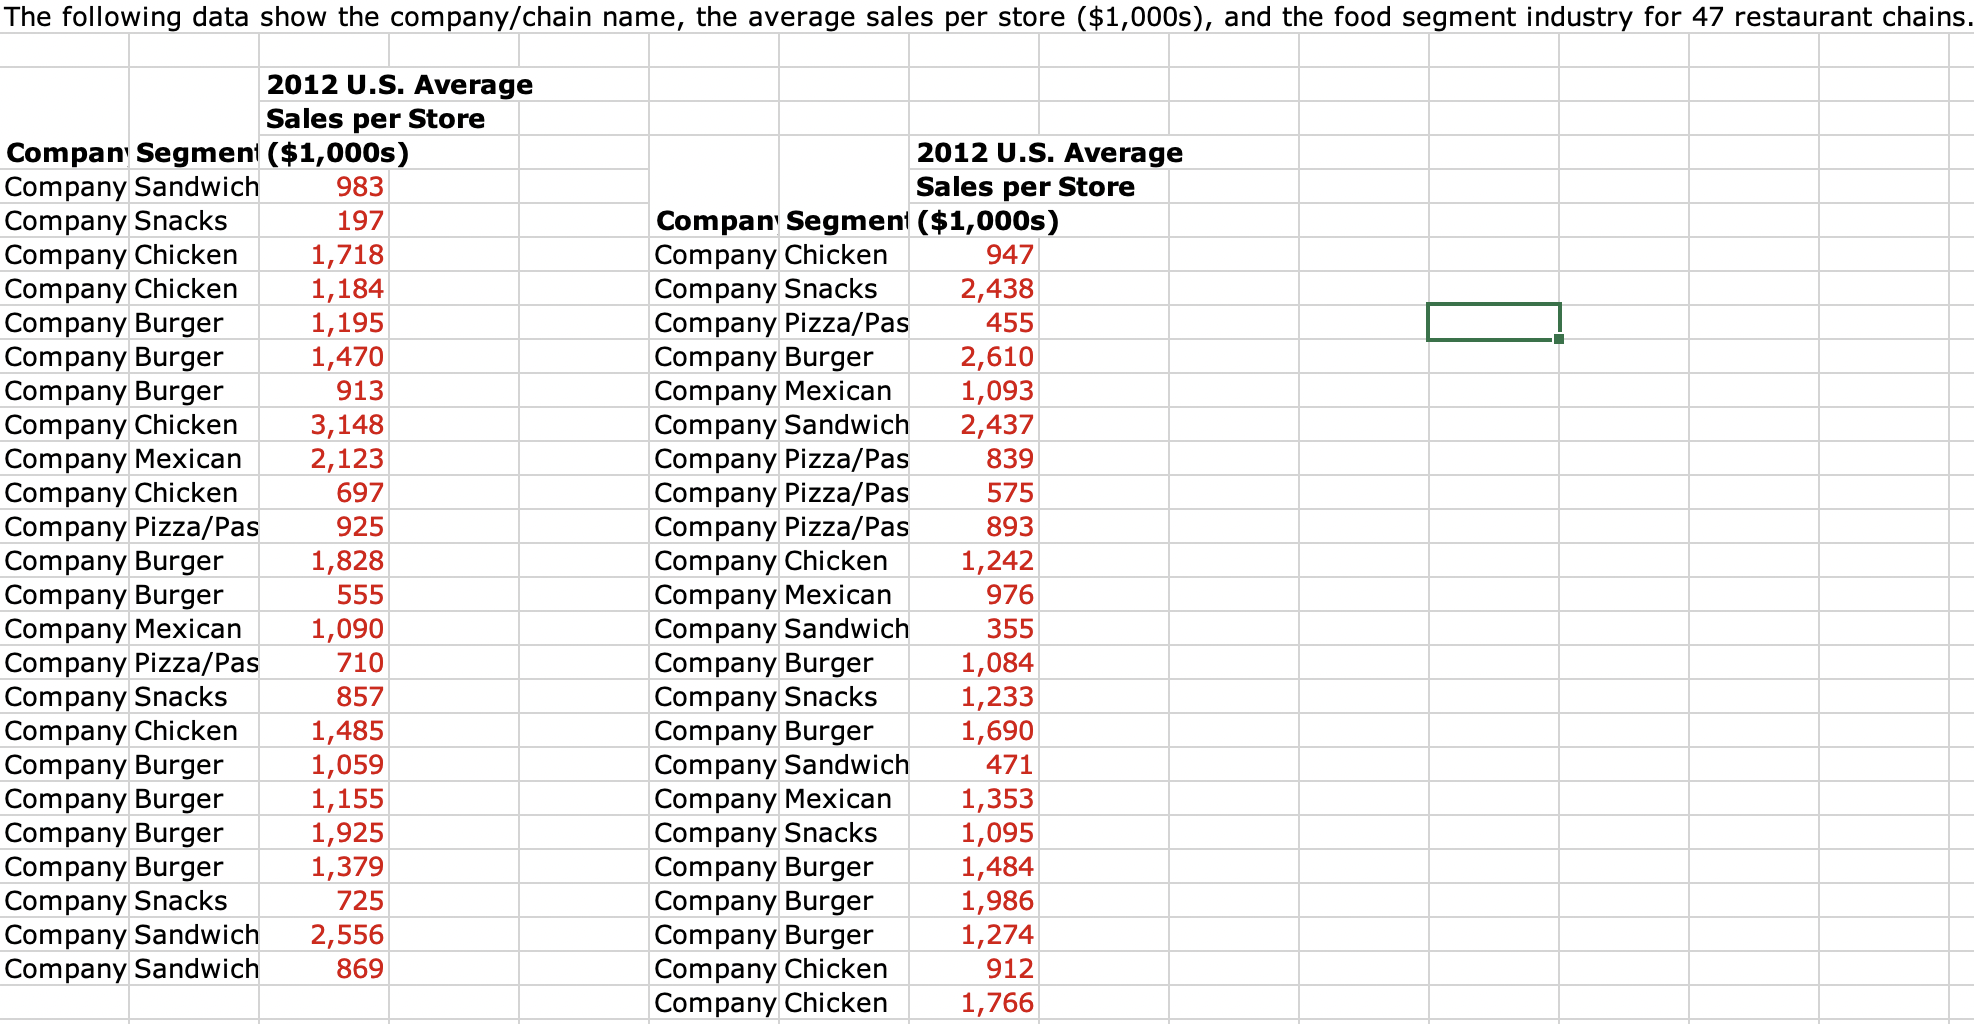
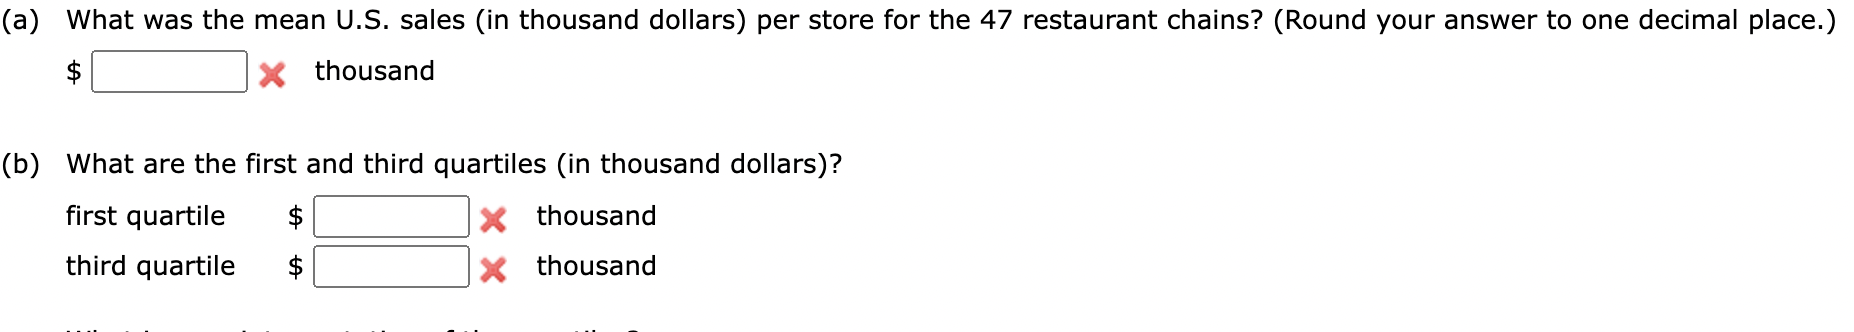
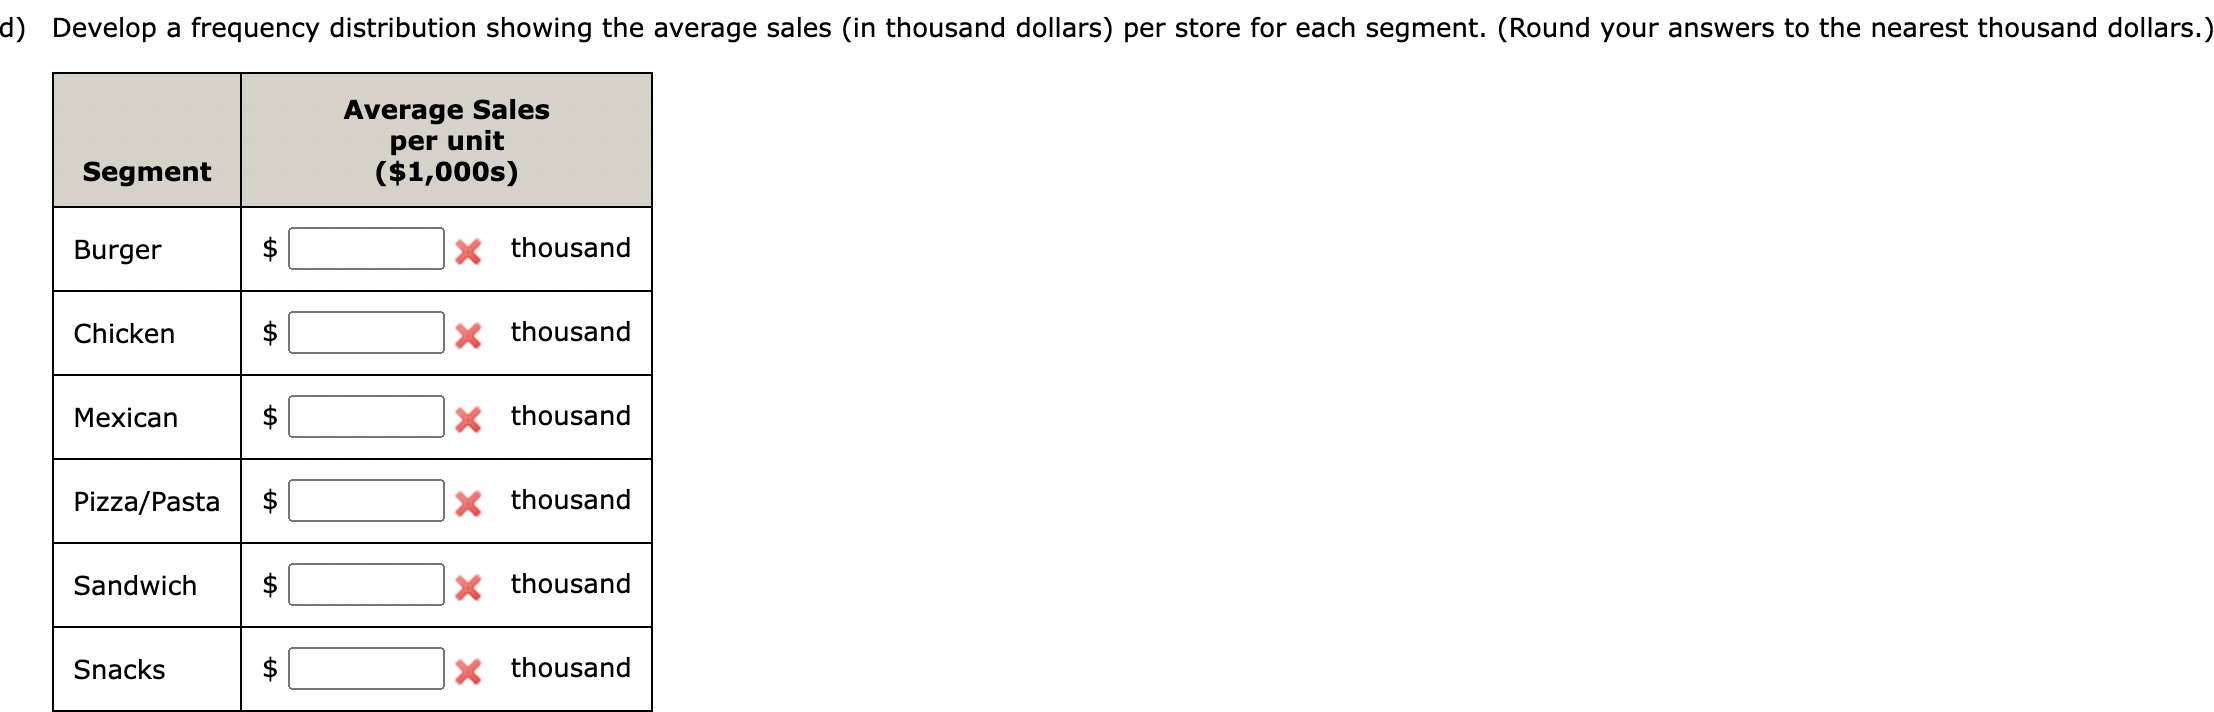
The following data show the company/chain name, the average sales per store ($1,000s), and the food segment industry for 47 restaurant chains. 2012 U.S. Average Sales per Store ($1,000s) Company Segmen Company Sandwich 2012 U.S. Average Sales per Store 983 Company Snacks 197 Company Chicken Company Segmen ($1,000s) Company Chicken 1,718 947 Company Chicken 1,184 Company Snacks 2,438 Company Burger Company Pizza/Pas 455 1,195 1,470 Company Burger 2,610 Company Burger Company Mexican 913 Company Burger Company Chicken 1,093 3,148 Company Sandwich 2,437 2,123 Company Pizza/Pas 839 697 Company Pizza/Pas 575 925 893 1,828 Company Pizza/Pas Company Chicken Company Mexican 1,242 555 976 1,090 Company Sandwich 355 710 Company Burger 1,084 Company Mexican Company Chicken Company Pizza/Pas Company Burger Company Burger Company Mexican Company Pizza/Pas Company Snacks Company Chicken Company Burger Company Burger Company Burger Company Burger Company Snacks Company Sandwich 857 Company Snacks 1,233 1,690 1,485 1,059 Company Burger Company Sandwich 471 1,155 Company Mexican 1,353 1,925 1,379 Company Snacks 1,095 Company Burger 1,484 725 Company Burger 1,986 2,556 1,274 Company Sandwich Company Burger Company Chicken 869 912 Company Chicken 1,766 (a) What was the mean U.S. sales (in thousand dollars) per store for the 47 restaurant chains? (Round your answer to one decimal place.) X thousand (b) What are the first and third quartiles (in thousand dollars)? first quartile X thousand third quartile X thousand d) Develop a frequency distribution showing the average sales (in thousand dollars) per store for each segment. (Round your answers to the nearest thousand dollars.) Average Sales per unit ($1,000s) Segment Burger Chicken Mexican Pizza/Pasta Sandwich Snacks LA tA LA X thousand X thousand X thousand X thousand X thousand X thousand The following data show the company/chain name, the average sales per store ($1,000s), and the food segment industry for 47 restaurant chains. 2012 U.S. Average Sales per Store ($1,000s) Company Segmen Company Sandwich 2012 U.S. Average Sales per Store 983 Company Snacks 197 Company Chicken Company Segmen ($1,000s) Company Chicken 1,718 947 Company Chicken 1,184 Company Snacks 2,438 Company Burger Company Pizza/Pas 455 1,195 1,470 Company Burger 2,610 Company Burger Company Mexican 913 Company Burger Company Chicken 1,093 3,148 Company Sandwich 2,437 2,123 Company Pizza/Pas 839 697 Company Pizza/Pas 575 925 893 1,828 Company Pizza/Pas Company Chicken Company Mexican 1,242 555 976 1,090 Company Sandwich 355 710 Company Burger 1,084 Company Mexican Company Chicken Company Pizza/Pas Company Burger Company Burger Company Mexican Company Pizza/Pas Company Snacks Company Chicken Company Burger Company Burger Company Burger Company Burger Company Snacks Company Sandwich 857 Company Snacks 1,233 1,690 1,485 1,059 Company Burger Company Sandwich 471 1,155 Company Mexican 1,353 1,925 1,379 Company Snacks 1,095 Company Burger 1,484 725 Company Burger 1,986 2,556 1,274 Company Sandwich Company Burger Company Chicken 869 912 Company Chicken 1,766 (a) What was the mean U.S. sales (in thousand dollars) per store for the 47 restaurant chains? (Round your answer to one decimal place.) X thousand (b) What are the first and third quartiles (in thousand dollars)? first quartile X thousand third quartile X thousand d) Develop a frequency distribution showing the average sales (in thousand dollars) per store for each segment. (Round your answers to the nearest thousand dollars.) Average Sales per unit ($1,000s) Segment Burger Chicken Mexican Pizza/Pasta Sandwich Snacks LA tA LA X thousand X thousand X thousand X thousand X thousand X thousand