Answered step by step
Verified Expert Solution
Question
1 Approved Answer
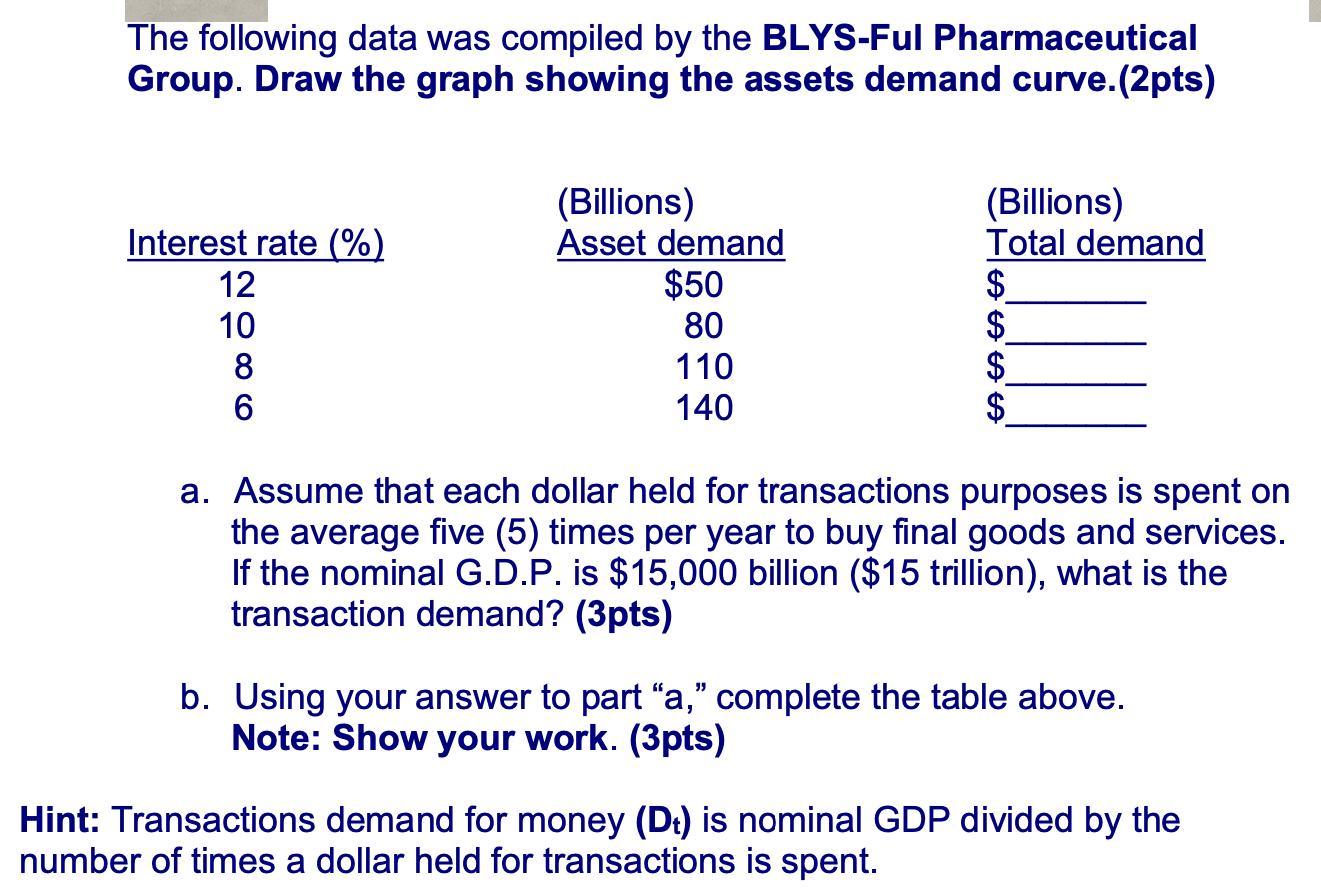
The following data was compiled by the BLYS-Ful Pharmaceutical Group. Draw the graph showing the assets demand curve.(2pts) Interest rate (%) 12 10 8

The following data was compiled by the BLYS-Ful Pharmaceutical Group. Draw the graph showing the assets demand curve.(2pts) Interest rate (%) 12 10 8 6 (Billions) Asset demand $50 80 110 140 (Billions) Total demand $ $ $ a. Assume that each dollar held for transactions purposes is spent on the average five (5) times per year to buy final goods and services. If the nominal G.D.P. is $15,000 billion ($15 trillion), what is the transaction demand? (3pts) b. Using your answer to part "a," complete the table above. Note: Show your work. (3pts) Hint: Transactions demand for money (D) is nominal GDP divided by the number of times a dollar held for transactions is spent.
Step by Step Solution
★★★★★
3.52 Rating (152 Votes )
There are 3 Steps involved in it
Step: 1
To draw the assets demand curve well plot the interest rate on the xaxis and the asset demand on the ...
Get Instant Access to Expert-Tailored Solutions
See step-by-step solutions with expert insights and AI powered tools for academic success
Step: 2

Step: 3

Ace Your Homework with AI
Get the answers you need in no time with our AI-driven, step-by-step assistance
Get Started


