Answered step by step
Verified Expert Solution
Question
1 Approved Answer
The following diagram represents the risk/return position of four portfolios of shares. Portfolio D is the market portfolio (the portfolio made up of all


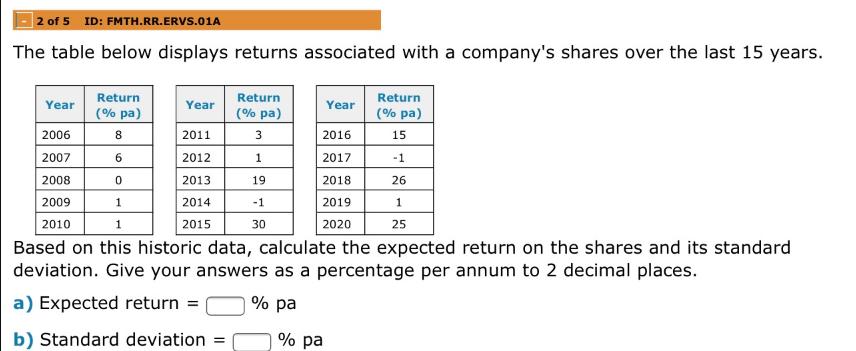
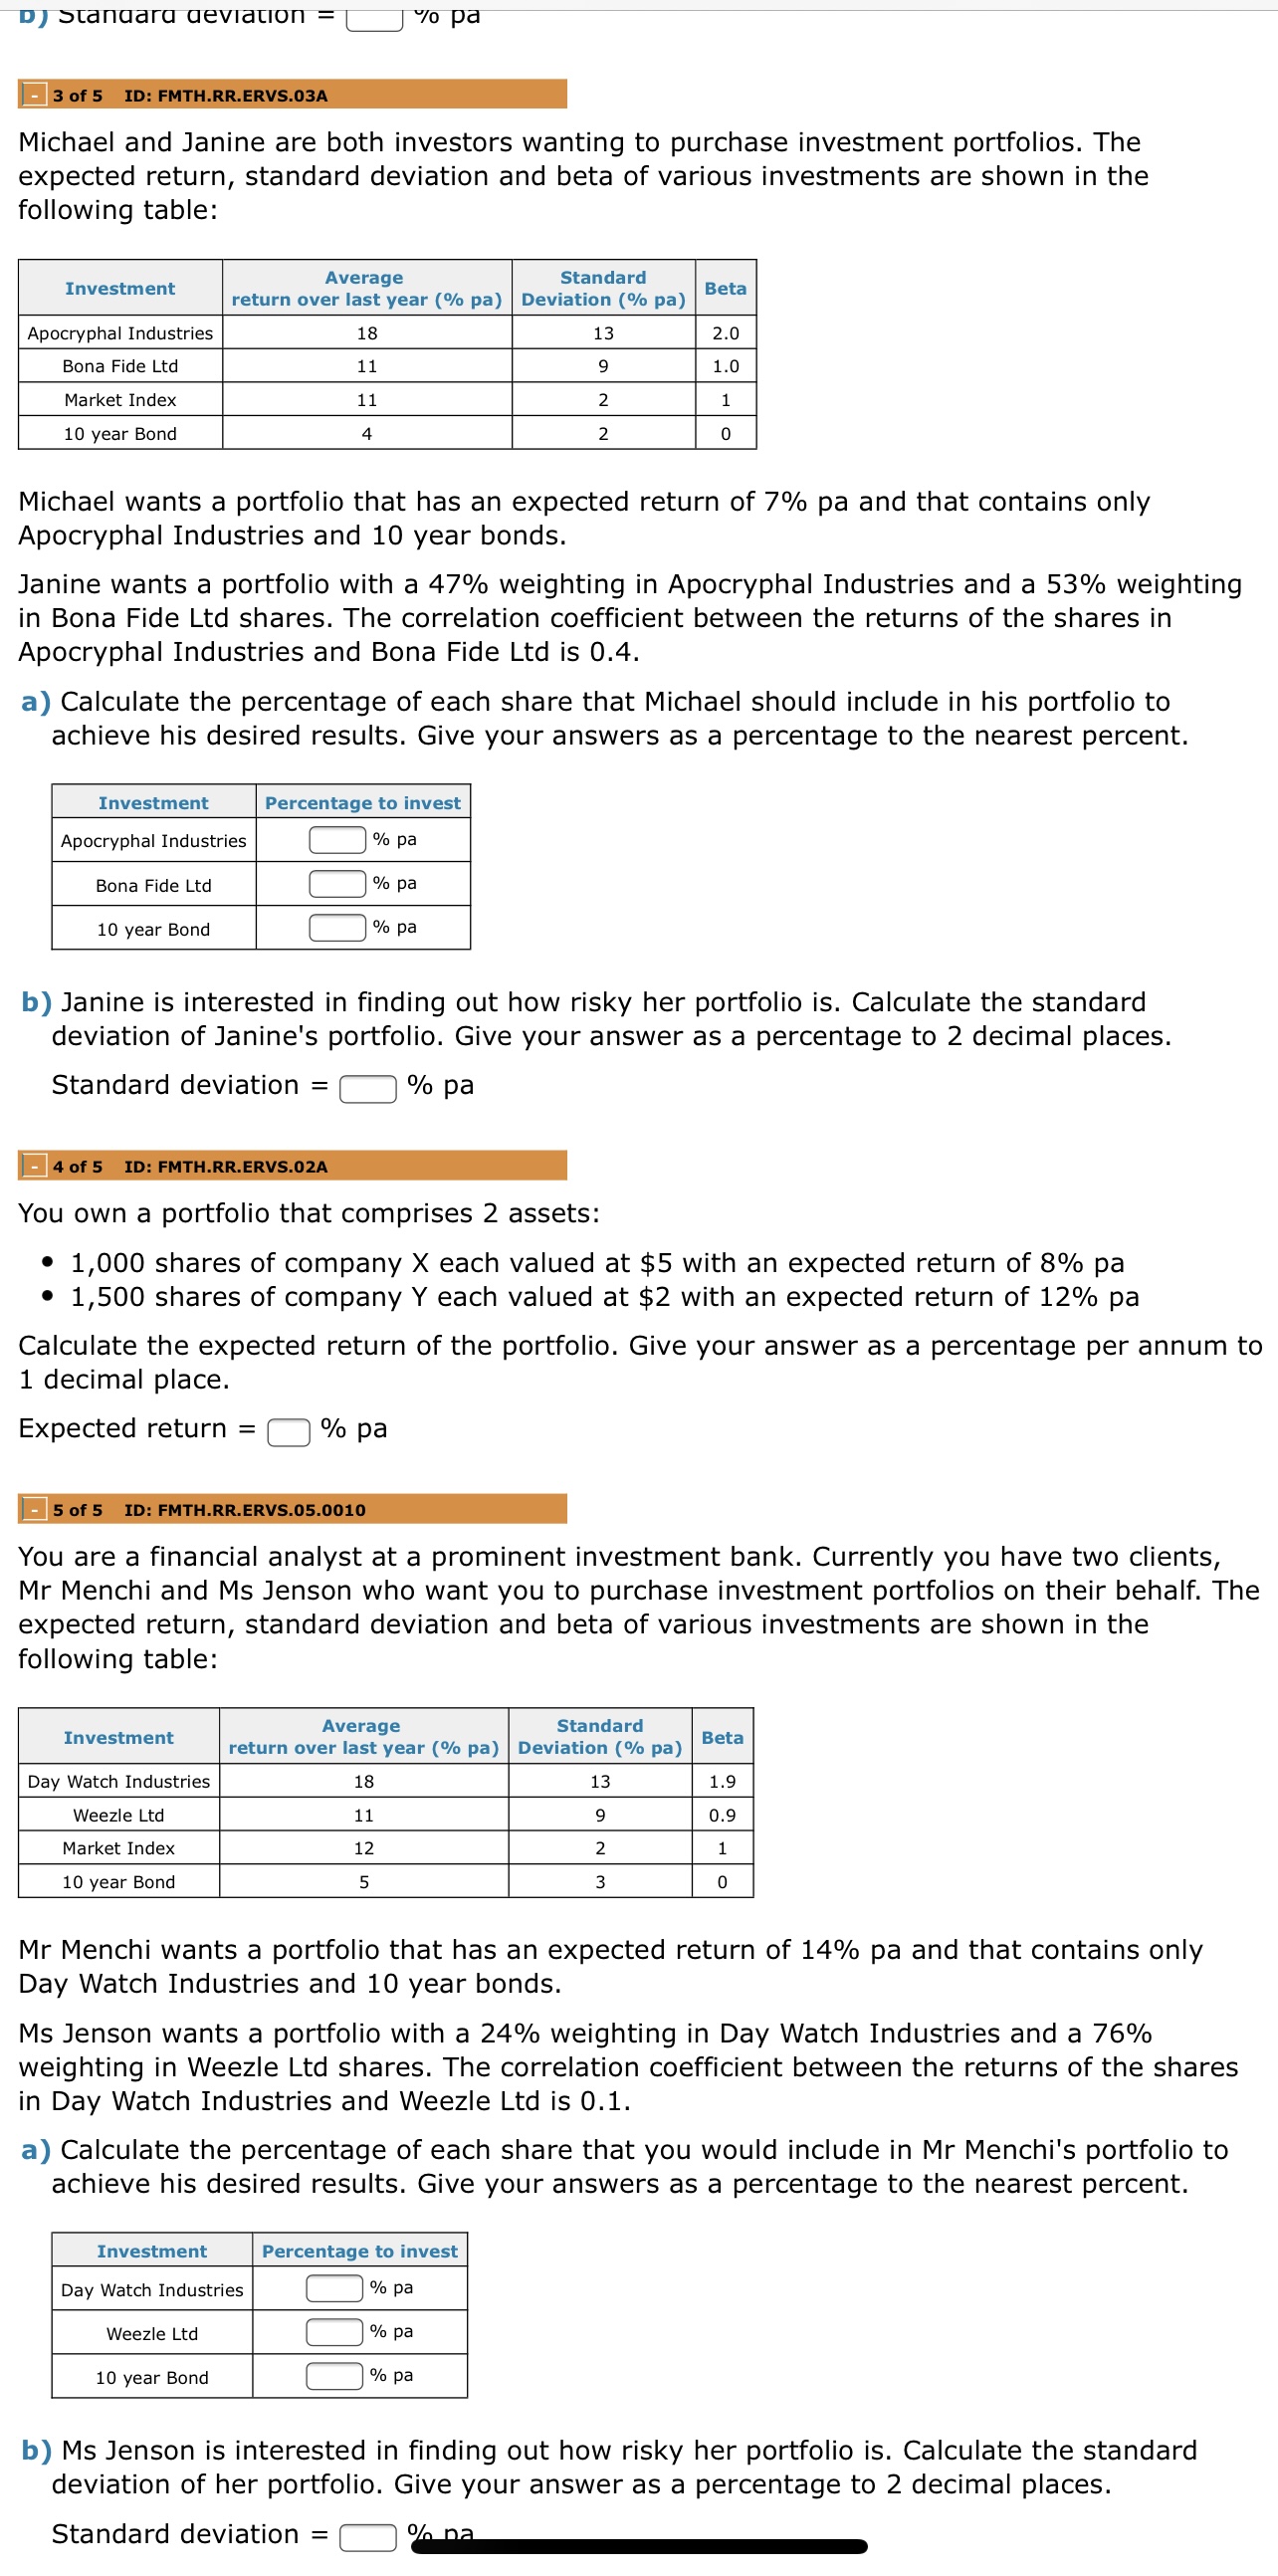
The following diagram represents the risk/return position of four portfolios of shares. Portfolio D is the market portfolio (the portfolio made up of all risky assets in the market in the same proportion by market value as they exist in the market). Portfolio B is known to be efficient and portfolio A is an inefficient portfolio that is part of the feasible set of portfolios. a) Based on this information, click and drag the line (representing the efficient frontier) from the green background onto the correct position on the diagram: E(R) B D A b) Point D is the market portfolio. Select the true statement regarding the portfolios on the risk/return diagram: OPortfolio B lies on the capital market line and would have a beta of 1 OPortfolio D lies on the capital market line and would have a beta of 1 2 of 5 ID: FMTH.RR.ERVS.01A The table below displays returns associated with a company's shares over the last 15 years. Year 2006 2007 2008 2009 2010 Return (% pa) 8 6 Year 2011 2012 2013 2014 2015 Return (% pa) 3 1 19 -1 30 Year 2016 2017 2018 2019 2020 Return (% pa) 15 -1 26 1 25 0 1 1 Based on this historic data, calculate the expected return on the shares and its standard deviation. Give your answers as a percentage per annum to 2 decimal places. a) Expected return = % pa b) Standard deviation = % pa DJ Standard deviation = 3 of 5 ID: FMTH.RR.ERVS.03A Michael and Janine are both investors wanting to purchase investment portfolios. The expected return, standard deviation and beta of various investments are shown in the following table: Investment Apocryphal Industries Bona Fide Ltd Market Index 10 year Bond Investment Michael wants a portfolio that has an expected return of 7% pa and that contains only Apocryphal Industries and 10 year bonds. Apocryphal Industries Bona Fide Ltd 10 year Bond Janine wants a portfolio with a 47% weighting in Apocryphal Industries and a 53% weighting in Bona Fide Ltd shares. The correlation coefficient between the returns of the shares in Apocryphal Industries and Bona Fide Ltd is 0.4. a) Calculate the percentage of each share that Michael should include in his portfolio to achieve his desired results. Give your answers as a percentage to the nearest percent. Average Standard return over last year (% pa) Deviation (% pa) 18 11 11 4 4 of 5 ID: FMTH.RR.ERVS.02A % pa Investment Day Watch Industries Weezle Ltd Market Index 10 year Bond b) Janine is interested in finding out how risky her portfolio is. Calculate the standard deviation of Janine's portfolio. Give your answer as a percentage to 2 decimal places. Standard deviation = % pa 5 of 5 ID: FMTH.RR.ERVS.05.0010 Percentage to invest % pa You own a portfolio that comprises 2 assets: 1,000 shares of company X each valued at $5 with an expected return of 8% pa 1,500 shares of company Y each valued at $2 with an expected return of 12% pa = Calculate the expected return of the portfolio. Give your answer as a percentage per annum to 1 decimal place. Expected return Investment % pa % pa Weezle Ltd 13 9 2 2 10 year Bond % pa You are a financial analyst at a prominent investment bank. Currently you have two clients, Mr Menchi and Ms Jenson who want you to purchase investment portfolios on their behalf. The expected return, standard deviation and beta of various investments are shown in the following table: Day Watch Industries Beta 2.0 1.0 1 0 Average Standard return over last year (% pa) | Deviation (% pa) 18 11 12 5 Mr Menchi wants a portfolio that has an expected return of 14% pa and that contains only Day Watch Industries and 10 year bonds. 13 9 2 3 Ms Jenson wants a portfolio with a 24% weighting in Day Watch Industries and a 76% weighting in Weezle Ltd shares. The correlation coefficient between the returns of the shares in Day Watch Industries and Weezle Ltd is 0.1. Percentage to invest % pa % pa a) Calculate the percentage of each share that you would include in Mr Menchi's portfolio to achieve his desired results. Give your answers as a percentage to the nearest percent. % pa Beta 1.9 0.9 1 0 b) Ms Jenson is interested in finding out how risky her portfolio is. Calculate the standard deviation of her portfolio. Give your answer as a percentage to 2 decimal places. Standard deviation = % na
Step by Step Solution
There are 3 Steps involved in it
Step: 1
Here are the stepbystep workings for the questions a For Mr Menchis portfolio Desired expected retu...
Get Instant Access to Expert-Tailored Solutions
See step-by-step solutions with expert insights and AI powered tools for academic success
Step: 2

Step: 3

Ace Your Homework with AI
Get the answers you need in no time with our AI-driven, step-by-step assistance
Get Started


