Answered step by step
Verified Expert Solution
Question
1 Approved Answer
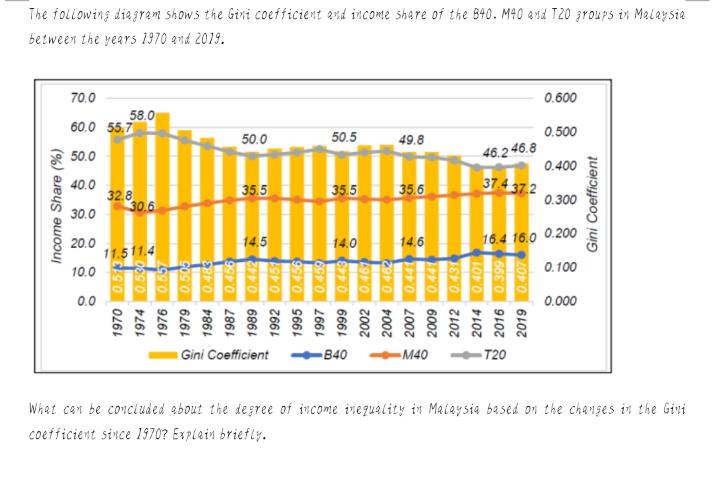
The following diagram shows the Gint coefficient and income share of the B40. M40 and T20 groups in Malaysia between the years 1970 and

The following diagram shows the Gint coefficient and income share of the B40. M40 and T20 groups in Malaysia between the years 1970 and 2019. Income Share (%) 70.0 60.0 55.7 50.0 40.0 30.0 20.0 10.0 0.0 58.0 32.8 30.6 11.511.4 1970 0.513 1974 0.530 1976 0.557 1979 0.505 1984 0.483 1987 0.456 50.0 35.5 14.5 50.5 Gini Coefficient 35.5 14.0 49.8 -B40 IMBE 35.6 9 14.6 1989 0.442 1992 0.451 1995 0.456 1997 0.459 1999 0.443 2002 0.467 2004 0.462 2007 0.441 2009 0.441 2012 0.431 2014 0.401 2016 0.399 2019 0.407 46.246.8 37.4.37.2 M40 0.600 T20 0.500 0.300 16.4 16.0 0.200 0.400 0.100 0.000 Gini Coefficient What can be concluded about the degree of income inequality in Malaysia based on the changes in the Gini coefficient since 1970? Explain briefly.
Step by Step Solution
★★★★★
3.29 Rating (158 Votes )
There are 3 Steps involved in it
Step: 1
Based on the information provided in the diagram we can analyze the following 1 Gini Coefficient The ...
Get Instant Access to Expert-Tailored Solutions
See step-by-step solutions with expert insights and AI powered tools for academic success
Step: 2

Step: 3

Ace Your Homework with AI
Get the answers you need in no time with our AI-driven, step-by-step assistance
Get Started


