Question
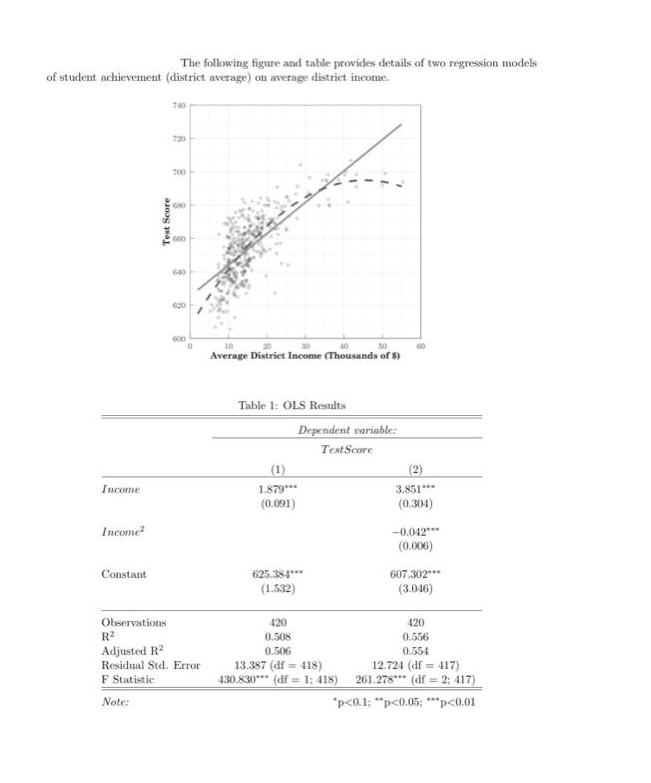
The following figure and table provides details of two regression models of student achievement (district average) on average district income. Income Income Constant Test


The following figure and table provides details of two regression models of student achievement (district average) on average district income. Income Income Constant Test Score 740 B 700 680 640 420 600 Observations R Adjusted R Residual Std. Error F Statistic Note: 10 50 Average District Income (Thousands of $) Table 1: OLS Results (1) 1.879*** (0.091) Dependent variable: Test Score 625.384*** (1.532) 420 0.508 3.851*** (0.304) 0.506 13.387 (df = 418) 430.830*** (df = 1: 418) -0.042*** (0.006) 607.302*** (3.046) 420 0.556 0.554 12.724 (df = 417) 261.278 (df = 2; 417) *p
Step by Step Solution
3.44 Rating (157 Votes )
There are 3 Steps involved in it
Step: 1

Get Instant Access to Expert-Tailored Solutions
See step-by-step solutions with expert insights and AI powered tools for academic success
Step: 2

Step: 3

Ace Your Homework with AI
Get the answers you need in no time with our AI-driven, step-by-step assistance
Get StartedRecommended Textbook for
Statistics Learning From Data
Authors: Roxy Peck
1st Edition
495553263, 978-1285966083, 1285966082, 978-0495553267
Students also viewed these Accounting questions
Question
Answered: 1 week ago
Question
Answered: 1 week ago
Question
Answered: 1 week ago
Question
Answered: 1 week ago
Question
Answered: 1 week ago
Question
Answered: 1 week ago
Question
Answered: 1 week ago
Question
Answered: 1 week ago
Question
Answered: 1 week ago
Question
Answered: 1 week ago
Question
Answered: 1 week ago
Question
Answered: 1 week ago
Question
Answered: 1 week ago
Question
Answered: 1 week ago
Question
Answered: 1 week ago
Question
Answered: 1 week ago
Question
Answered: 1 week ago
Question
Answered: 1 week ago
Question
Answered: 1 week ago
Question
Answered: 1 week ago
Question
Answered: 1 week ago
View Answer in SolutionInn App


