Answered step by step
Verified Expert Solution
Question
1 Approved Answer
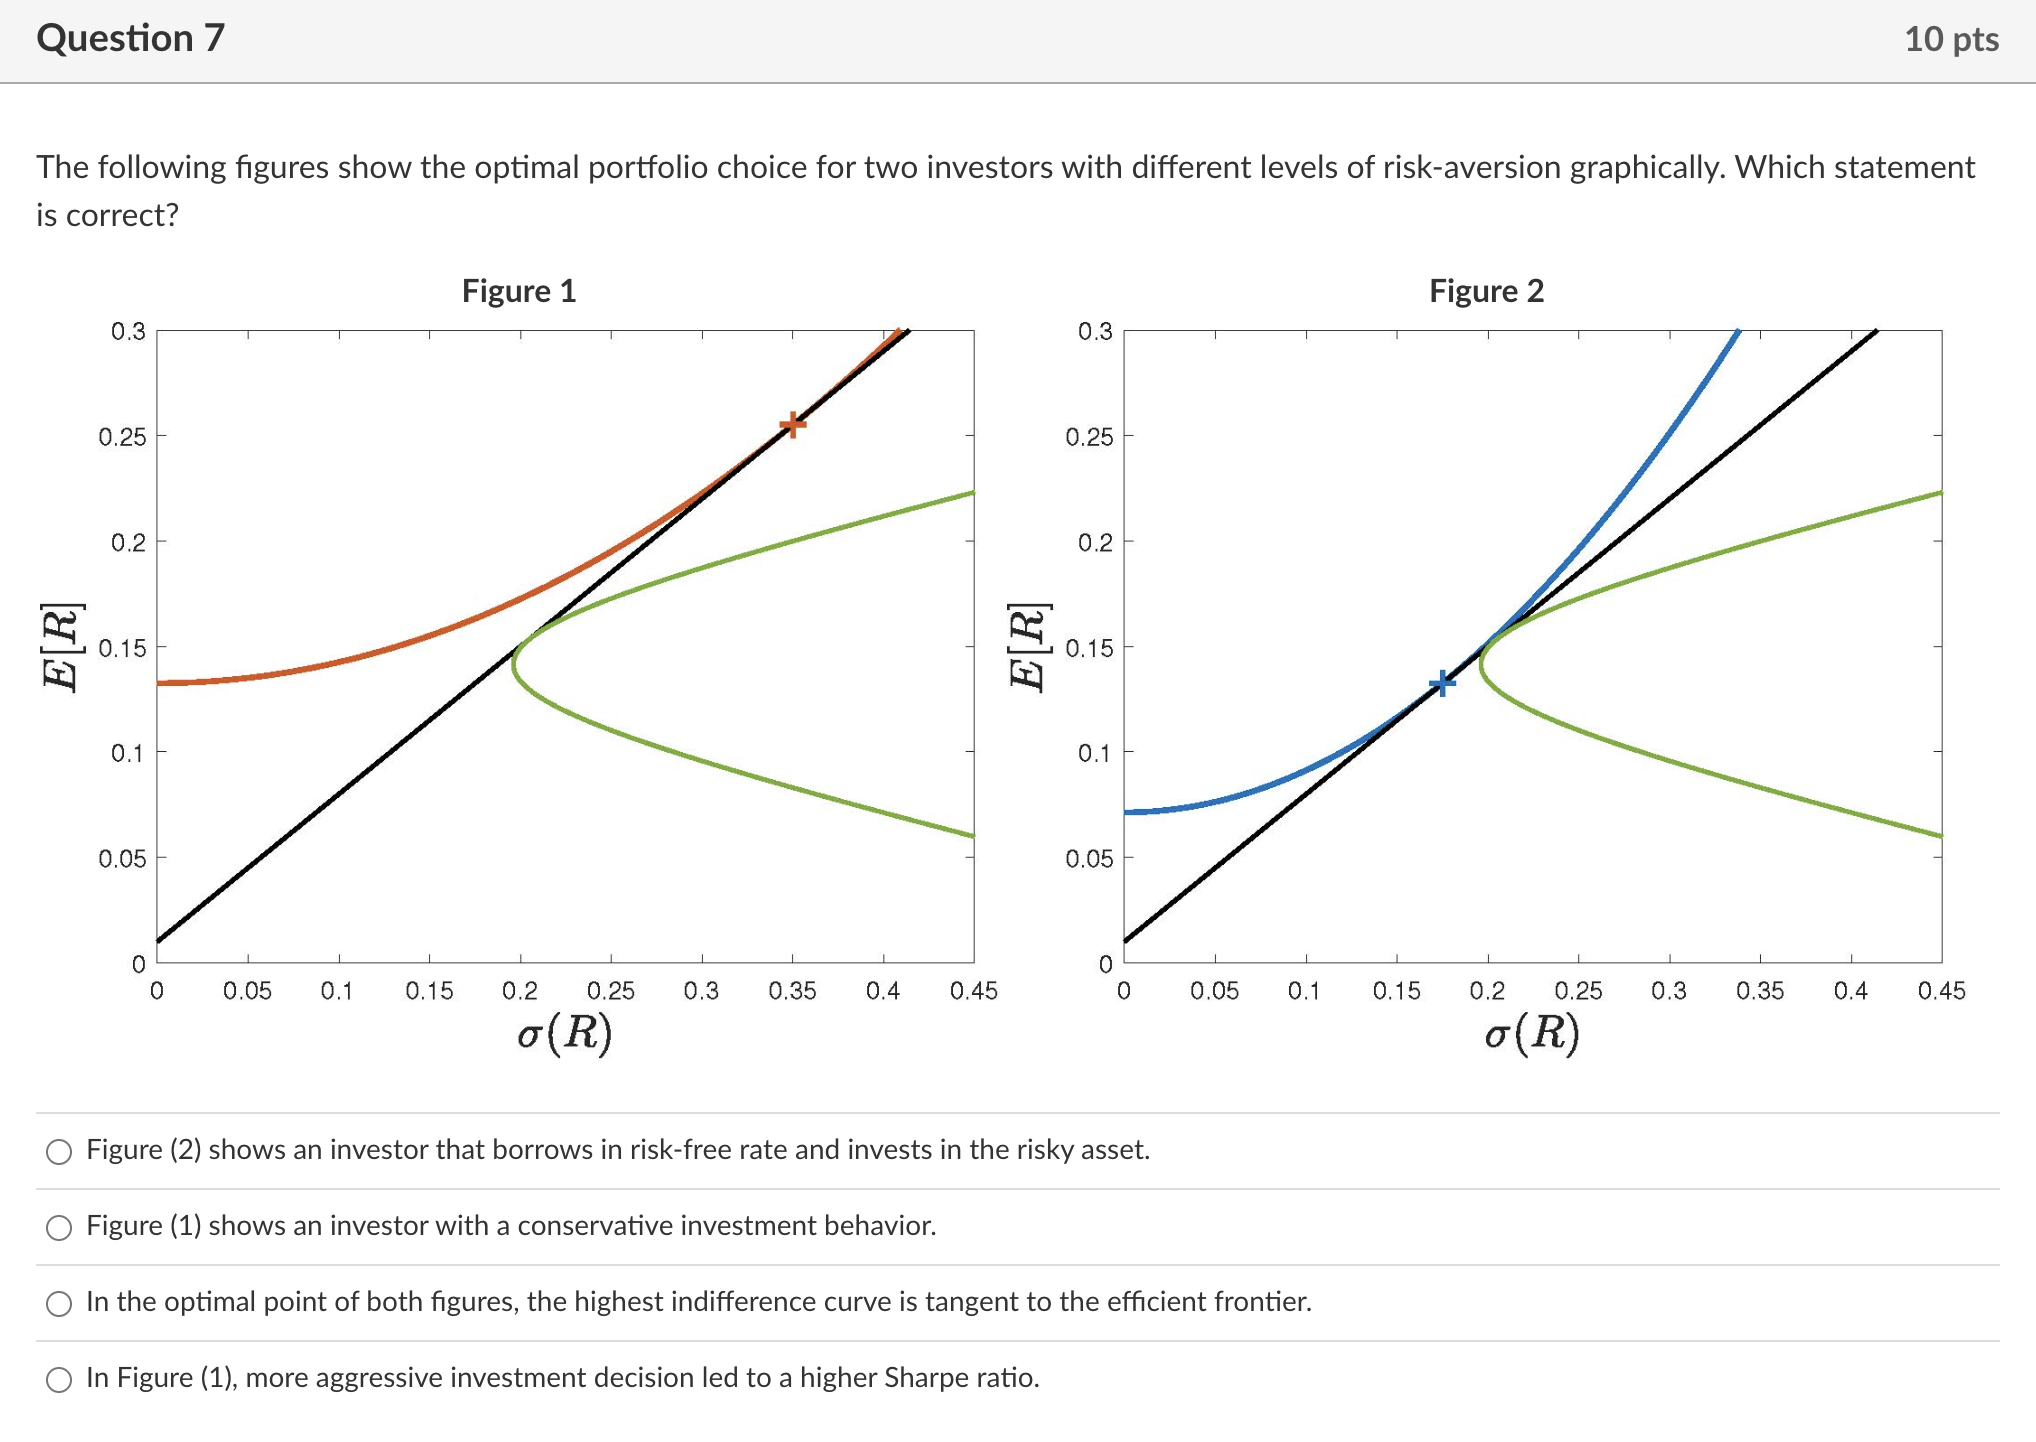
The following figures show the optimal portfolio choice for two investors with different levels of risk-aversion graphically. Which statement is correct? Figure (2) shows an
 The following figures show the optimal portfolio choice for two investors with different levels of risk-aversion graphically. Which statement is correct? Figure (2) shows an investor that borrows in risk-free rate and invests in the risky asset. Figure (1) shows an investor with a conservative investment behavior. In the optimal point of both figures, the highest indifference curve is tangent to the efficient frontier. In Figure (1), more aggressive investment decision led to a higher Sharpe ratio
 Step by Step Solution
There are 3 Steps involved in it
Step: 1

Get Instant Access to Expert-Tailored Solutions
See step-by-step solutions with expert insights and AI powered tools for academic success
Step: 2

Step: 3

Ace Your Homework with AI
Get the answers you need in no time with our AI-driven, step-by-step assistance
Get Started


