

Answered step by step
Verified Expert Solution
Question
1 Approved Answer
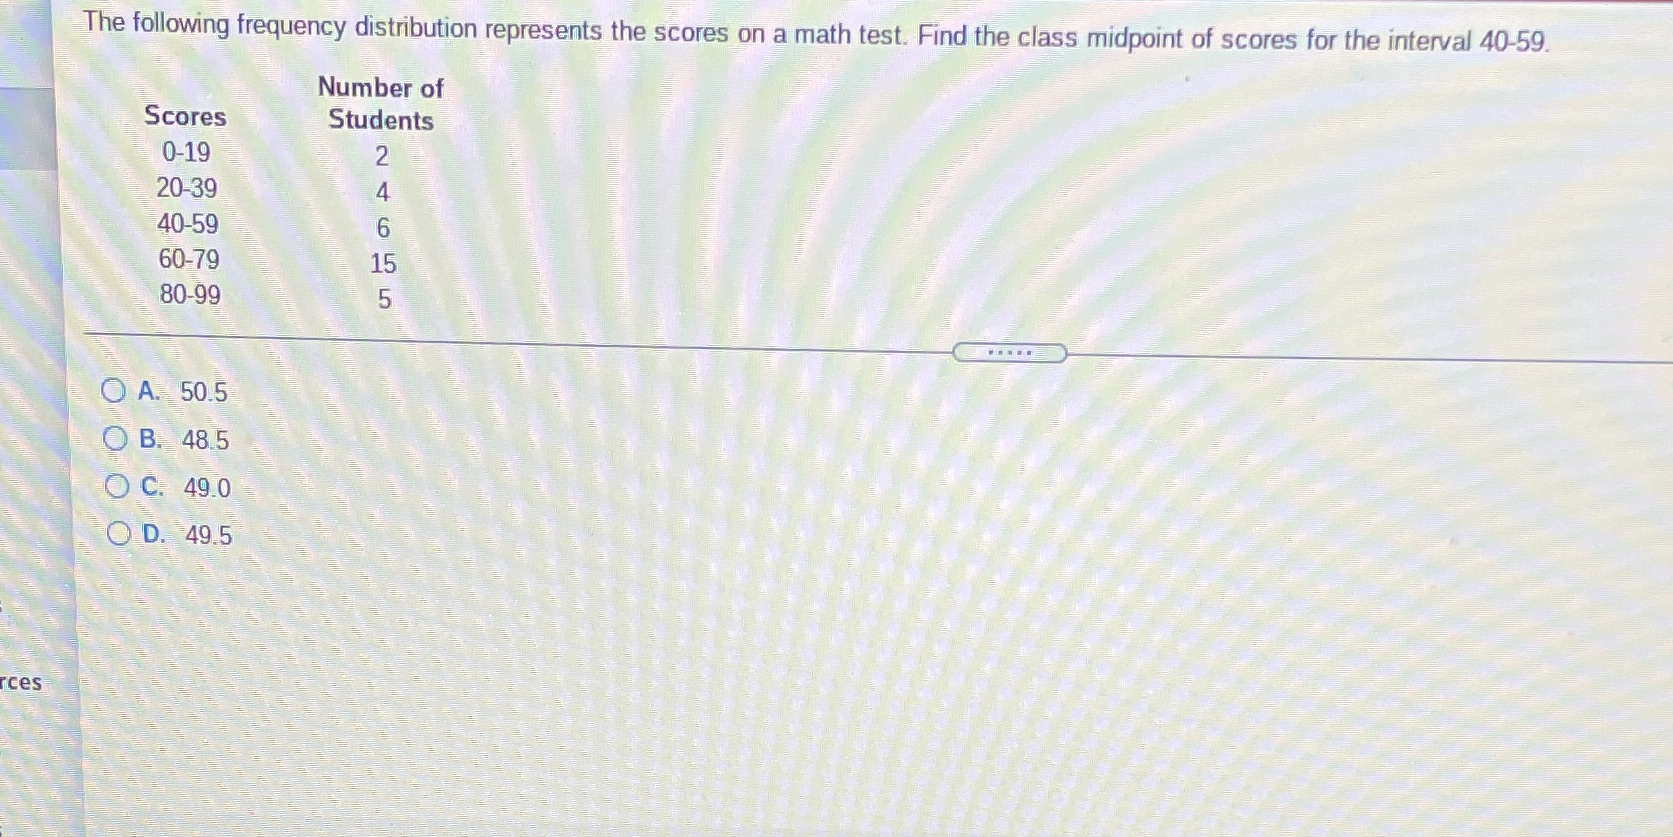
The following frequency distribution represents the scores on a math test. Find the class midpoint of scores for the interval 40-59. Number of Scores Students
Step by Step Solution
There are 3 Steps involved in it
Step: 1

Get Instant Access to Expert-Tailored Solutions
See step-by-step solutions with expert insights and AI powered tools for academic success
Step: 2

Step: 3
Ace Your Homework with AI
Get the answers you need in no time with our AI-driven, step-by-step assistance
Get Started
Elementary Statistics A Step By Step Approach
Authors: Allan Bluman
8th Edition
73386103, 978-0073386102