Answered step by step
Verified Expert Solution
Question
1 Approved Answer
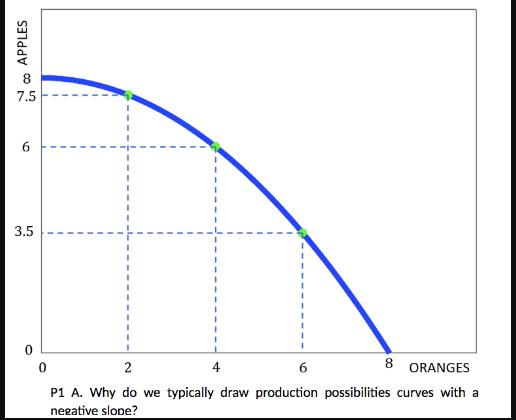
The following graph depicts a Production Possibilities Curve for an economy that can only produce apples or oranges. If the economy's resources are all


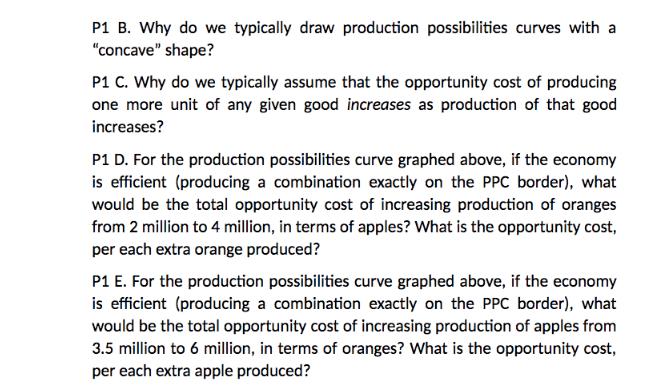
The following graph depicts a Production Possibilities Curve for an economy that can only produce apples or oranges. If the economy's resources are all devoted to producing apples, then 8 million apples would be produced. If the economy's resources are all devoted to producing oranges, then 8 million oranges would be produced. APPLES in co 7.5 6 3.5 8 0 2 6 ORANGES P1 A. Why do we typically draw production possibilities curves with a negative slope? P1 B. Why do we typically draw production possibilities curves with a "concave" shape? P1 C. Why do we typically assume that the opportunity cost of producing one more unit of any given good increases as production of that good increases? P1 D. For the production possibilities curve graphed above, if the economy is efficient (producing a combination exactly on the PPC border), what would be the total opportunity cost of increasing production of oranges from 2 million to 4 million, in terms of apples? What is the opportunity cost, per each extra orange produced? P1 E. For the production possibilities curve graphed above, if the economy is efficient (producing a combination exactly on the PPC border), what would be the total opportunity cost of increasing production of apples from 3.5 million to 6 million, in terms of oranges? What is the opportunity cost, per each extra apple produced?
Step by Step Solution
★★★★★
3.44 Rating (151 Votes )
There are 3 Steps involved in it
Step: 1
P1 A Production possibilities curves are typically drawn with a negative slope because they represent the concept of opportunity cost ...
Get Instant Access to Expert-Tailored Solutions
See step-by-step solutions with expert insights and AI powered tools for academic success
Step: 2

Step: 3

Ace Your Homework with AI
Get the answers you need in no time with our AI-driven, step-by-step assistance
Get Started


