

Answered step by step
Verified Expert Solution
Question
1 Approved Answer
The following graph is an ogive of a standardized test's scores. The vertical axis in an ogive is the cumulative relative frequency and can
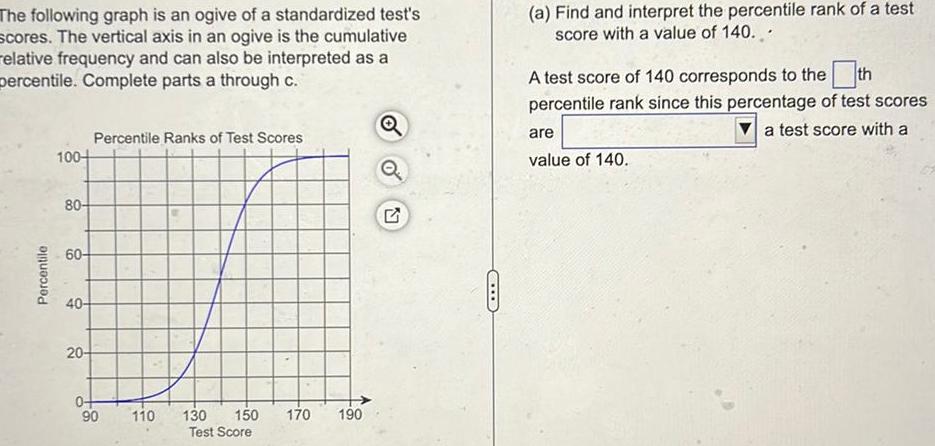
The following graph is an ogive of a standardized test's scores. The vertical axis in an ogive is the cumulative relative frequency and can also be interpreted as a percentile. Complete parts a through c. Q Percentile Ranks of Test Scores 100+ (a) Find and interpret the percentile rank of a test score with a value of 140... A test score of 140 corresponds to the th percentile rank since this percentage of test scores a test score with a are value of 140. Percentile 80- 60- 40- 20- 0+ 90 110 130 150 170 190 Test Score
Step by Step Solution
There are 3 Steps involved in it
Step: 1

Get Instant Access to Expert-Tailored Solutions
See step-by-step solutions with expert insights and AI powered tools for academic success
Step: 2

Step: 3
Ace Your Homework with AI
Get the answers you need in no time with our AI-driven, step-by-step assistance
Get Started
Quantitative Methods For Business Management And Finance
Authors: Louise Swift, Sally Piff
2nd Edition
1403935289, 9781403935281