

Answered step by step
Verified Expert Solution
Question
1 Approved Answer
The following graph plots the current security market line (SML) and indicates the return that investors require from holding stock from Happy Corp. (HC). Based
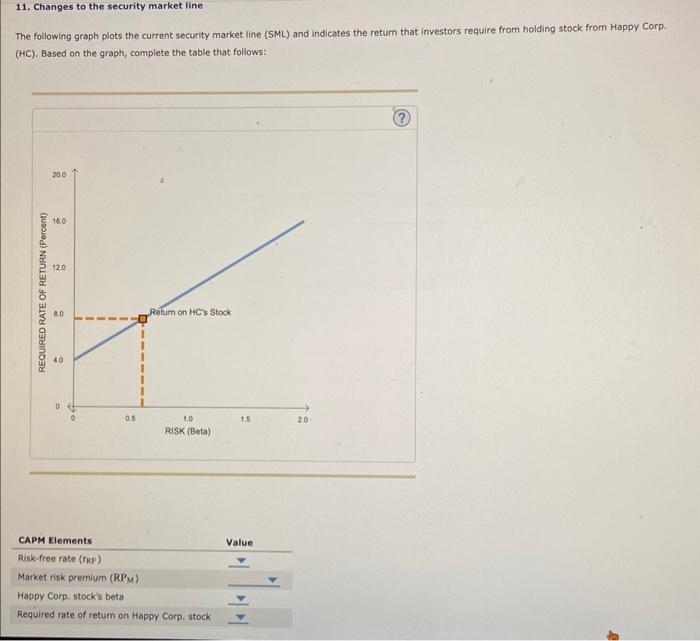
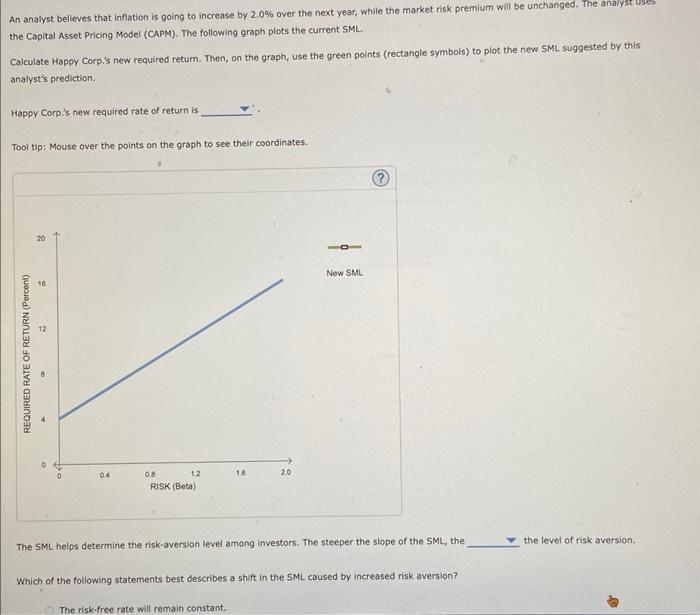 The following graph plots the current security market line (SML) and indicates the return that investors require from holding stock from Happy Corp. (HC). Based on the graph, complete the table that follows: An analyst believes that infiation is going to increase by 2.0% over the next year, while the market risk premium will be unchanged. the Capital Asset Pricing Model (CAPM). The following graph plots the current SML. Calculate Happy Corp.'s new required return. Then, on the graph, use the green points (rectangle symbois) to plot the new SML suggested by this analyst's prediction. Happy Corp.'s new required rate of return is Tool tip: Mouse over the points on the graph to see their coordinates. The SML helps determine the risk-aversion level among investors, The steeper the slope of the SML, the the level of risk aversion. Which of the following statements best describes a shift in the SML caused by increased risk aversion? The risk-free rate will remain constant
Step by Step Solution
There are 3 Steps involved in it
Step: 1

Get Instant Access to Expert-Tailored Solutions
See step-by-step solutions with expert insights and AI powered tools for academic success
Step: 2

Step: 3
Ace Your Homework with AI
Get the answers you need in no time with our AI-driven, step-by-step assistance
Get Started
Accounting Tools for Business Decision Making
Authors: Paul D. Kimmel, Jerry J. Weygandt, Donald E. Kieso
5th edition
9780470418239, 470239808, 9780470239803, 470418230, 978-1118128169