Answered step by step
Verified Expert Solution
Link Copied!

Question

1 Approved Answer

The following graph plots the current security market line (SML) and indicates the return that investors require from holding stock from Happy Corp. (HC). Based
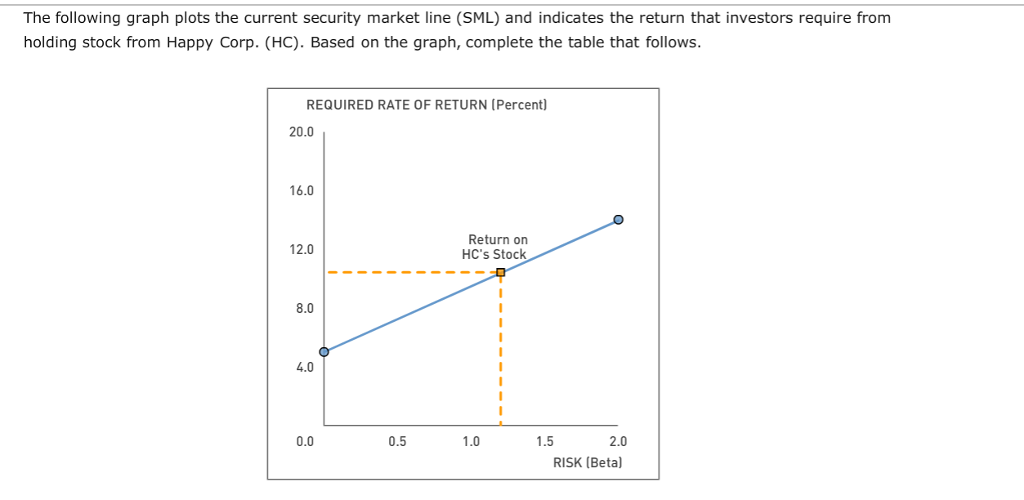
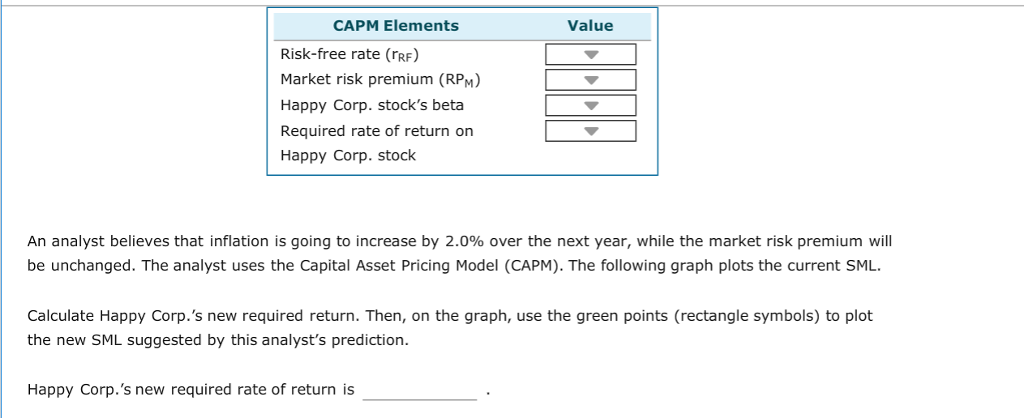
image text in transcribed

image text in transcribed

image text in transcribed

image text in transcribed

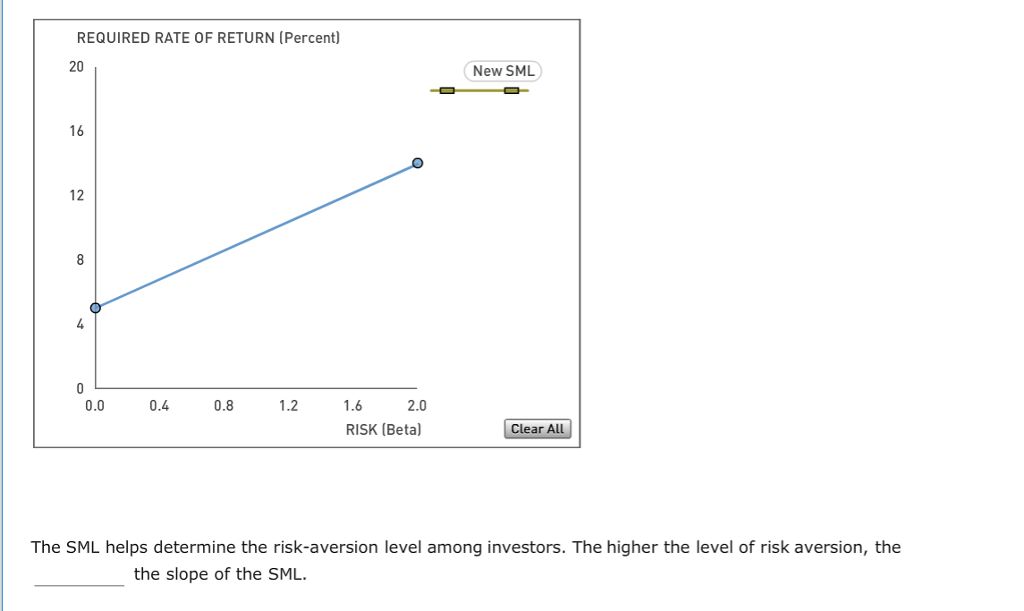
The following graph plots the current security market line (SML) and indicates the return that investors require from holding stock from Happy Corp. (HC). Based on the graph, complete the table that follows. REQUIRED RATE OF RETURN (Percent) 20.0 16.0 Return on HC's Stock 12.0 8.0 4.0 0.0 0.5 1.0 1.5 2.0 RISK (Beta The following graph plots the current security market line (SML) and indicates the return that investors require from holding stock from Happy Corp. (HC). Based on the graph, complete the table that follows. REQUIRED RATE OF RETURN (Percent) 20.0 16.0 Return on HC's Stock 12.0 8.0 4.0 0.0 0.5 1.0 1.5 2.0 RISK (Beta
Step by Step Solution

There are 3 Steps involved in it

Step: 1

blur-text-image

Get Instant Access to Expert-Tailored Solutions

See step-by-step solutions with expert insights and AI powered tools for academic success

Step: 2

blur-text-image

Step: 3

blur-text-image

Ace Your Homework with AI

Get the answers you need in no time with our AI-driven, step-by-step assistance

Get Started

Recommended Textbook for

Understanding ETF Options Profitable Strategies For Diversified Low Risk Investing

Authors: Kenneth R. Trester

1st Edition

007176030X, 0071760431, 9780071760430

More Books

Students also viewed these Finance questions

Question

What is an interface? What keyword is used to define one?

Answered: 1 week ago