Answered step by step
Verified Expert Solution
Link Copied!

Question

1 Approved Answer

The following graph plots the percentage change in the spot rate for a foreign currency along the horizontal axis, while measuring the interest rate differential
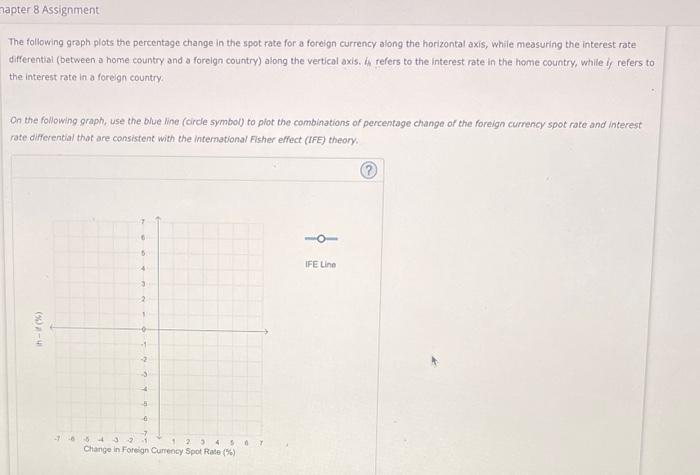
image text in transcribed
The following graph plots the percentage change in the spot rate for a foreign currency along the horizontal axis, while measuring the interest rate differential (between a home countiy and a forelgn country) along the vertical axis. in refers to the interest rate in the home country, while if refers to the interest rate in a foregn country. On the following graph, use the blue line (circle symbol) to plot the combinations of percentage change of the foreign curnency spot rate and interest rate differential that are consistent with the international Fisher effect (IFE) theory

Step by Step Solution

There are 3 Steps involved in it

Step: 1

blur-text-image

Get Instant Access to Expert-Tailored Solutions

See step-by-step solutions with expert insights and AI powered tools for academic success

Step: 2

blur-text-image

Step: 3

blur-text-image

Ace Your Homework with AI

Get the answers you need in no time with our AI-driven, step-by-step assistance

Get Started

Students also viewed these Finance questions

Question

Describe the recurring counsel about how to respond to crisis.

Answered: 1 week ago