

Answered step by step
Verified Expert Solution
Question
1 Approved Answer
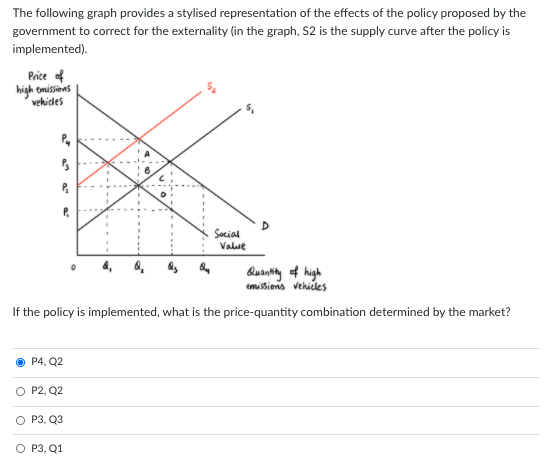
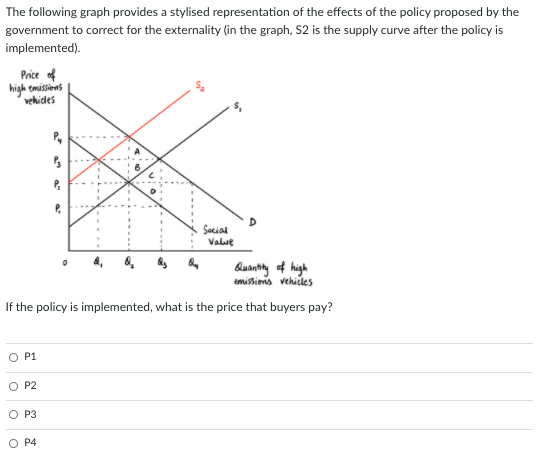
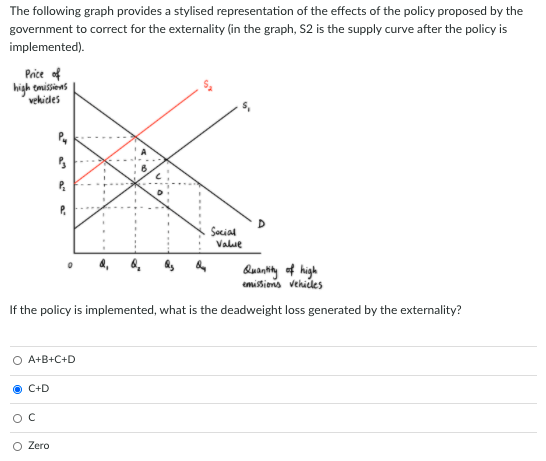
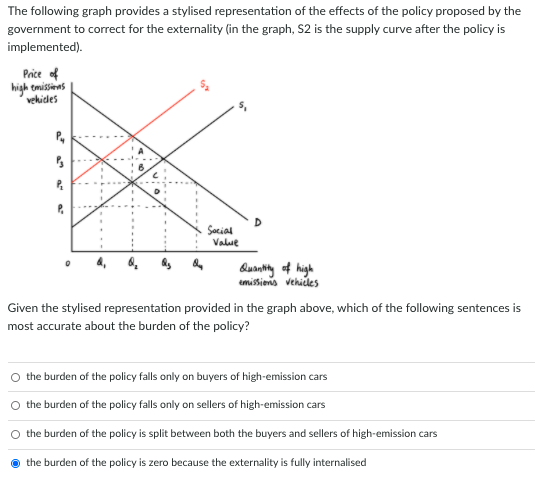
The following graph provides a stylised representation of the effects of the policy proposed by the government to correct for the externality (in the graph,
Step by Step Solution
There are 3 Steps involved in it
Step: 1

Get Instant Access to Expert-Tailored Solutions
See step-by-step solutions with expert insights and AI powered tools for academic success
Step: 2

Step: 3
Ace Your Homework with AI
Get the answers you need in no time with our AI-driven, step-by-step assistance
Get Started
Managerial Economics and Business Strategy
Authors: Michael R. baye
7th Edition
978-0073375960, 71267441, 73375969, 978-0071267441