Answered step by step
Verified Expert Solution
Question
1 Approved Answer
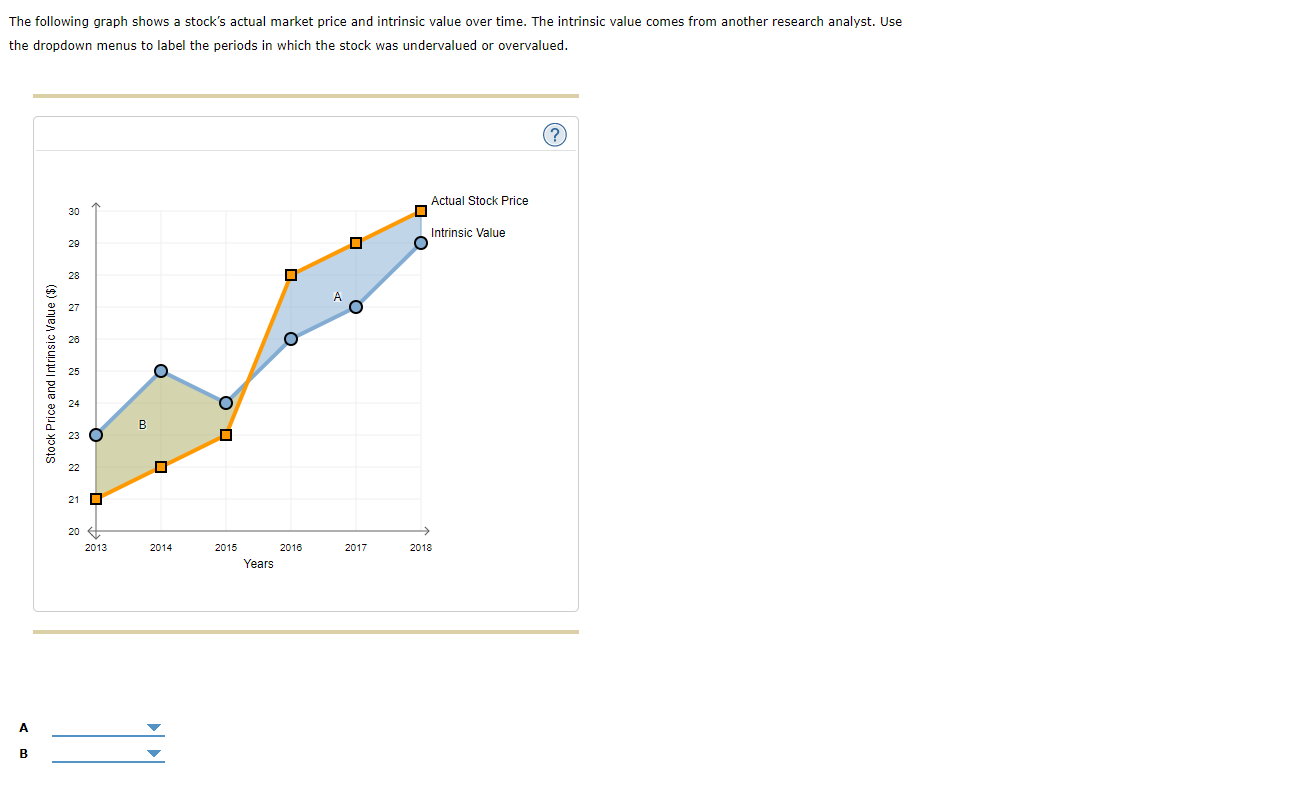
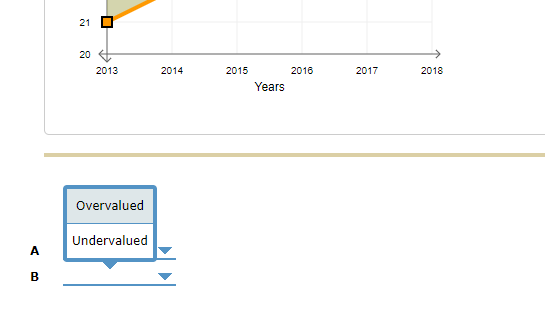
The following graph shows a stock's actual market price and intrinsic value over time. The intrinsic value comes from another research analyst. Use the dropdown
Step by Step Solution
There are 3 Steps involved in it
Step: 1

Get Instant Access to Expert-Tailored Solutions
See step-by-step solutions with expert insights and AI powered tools for academic success
Step: 2

Step: 3
Ace Your Homework with AI
Get the answers you need in no time with our AI-driven, step-by-step assistance
Get Started