

Question
The following graph shows experimental demixion curves obtained in the case of cyclohexane/PS solution at different polymerization degrees (Dp) of PS (a, b and c).
The following graph shows experimental demixion curves obtained in the case of cyclohexane/PS solution at different polymerization degrees (Dp) of PS (a, b and c).
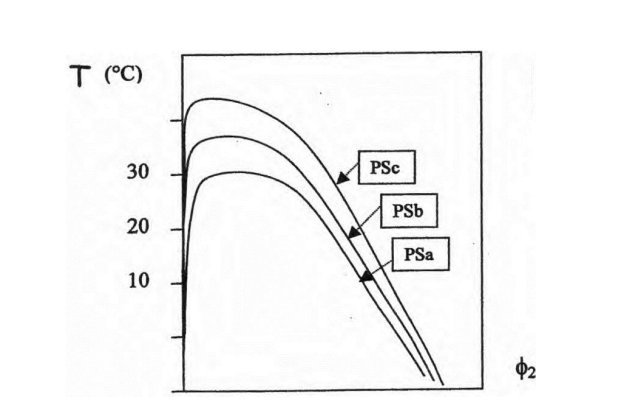
1. Indicate on the graph the solubility and immiscibility areas.
2. Give the definition of the critical demixion temperature?
3. Indicate on the graph the critical demixion temperature point?
4. Determine graphically the value of the critical demixion temperature for each PS (a, b and c).
5. What is the effect of Dp on the solubility of the solution? Explain your answer.
2 2Step by Step Solution
There are 3 Steps involved in it
Step: 1

Get Instant Access to Expert-Tailored Solutions
See step-by-step solutions with expert insights and AI powered tools for academic success
Step: 2

Step: 3
Ace Your Homework with AI
Get the answers you need in no time with our AI-driven, step-by-step assistance
Get Started
Financial Accounting Essentials You Always Wanted To Know Self Learning Management Series
Authors: Vibrant Publishers , Kalpesh Ashar
5th Edition
1636510973, 978-1636510972