Question
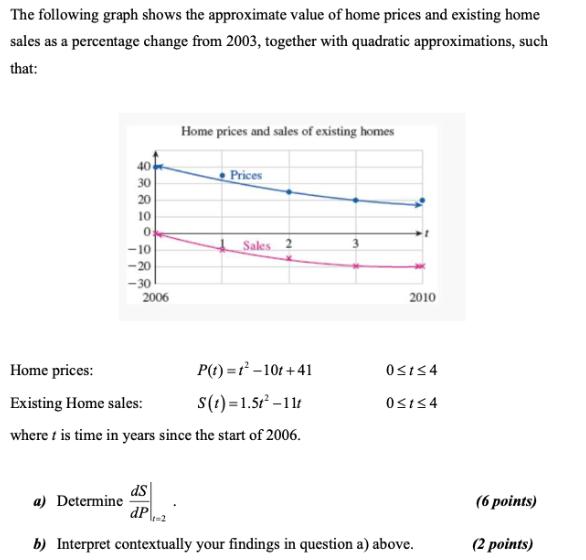
The following graph shows the approximate value of home prices and existing home sales as a percentage change from 2003, together with quadratic approximations,

The following graph shows the approximate value of home prices and existing home sales as a percentage change from 2003, together with quadratic approximations, such that: Home prices: 40 Home prices and sales of existing homes Prices 30 20 10 0: -10 -20 -30 2006 Existing Home sales: Sales 2 2010 P(t)=12-101 +41 014 S(t) 1.52-111 014 where is time in years since the start of 2006. ds a) Determine (6 points) dP-2 b) Interpret contextually your findings in question a) above. (2 points)
Step by Step Solution
There are 3 Steps involved in it
Step: 1

Get Instant Access to Expert-Tailored Solutions
See step-by-step solutions with expert insights and AI powered tools for academic success
Step: 2

Step: 3

Ace Your Homework with AI
Get the answers you need in no time with our AI-driven, step-by-step assistance
Get StartedRecommended Textbook for
Macroeconomics
Authors: Glenn Hubbard, Anthony Patrick O'Brien, Matthew P Rafferty
1st Edition
978-0132109994, 0132109999
Students also viewed these Mathematics questions
Question
Answered: 1 week ago
Question
Answered: 1 week ago
Question
Answered: 1 week ago
Question
Answered: 1 week ago
Question
Answered: 1 week ago
Question
Answered: 1 week ago
Question
Answered: 1 week ago
Question
Answered: 1 week ago
Question
Answered: 1 week ago
Question
Answered: 1 week ago
Question
Answered: 1 week ago
Question
Answered: 1 week ago
Question
Answered: 1 week ago
Question
Answered: 1 week ago
Question
Answered: 1 week ago
Question
Answered: 1 week ago
Question
Answered: 1 week ago
Question
Answered: 1 week ago
Question
Answered: 1 week ago
Question
Answered: 1 week ago
Question
Answered: 1 week ago
View Answer in SolutionInn App


