

Answered step by step
Verified Expert Solution
Question
1 Approved Answer
The following graph shows the behaviour of average cumulative abnormal return for a sample of companies that announced negative earnings forecasts. It presents daily
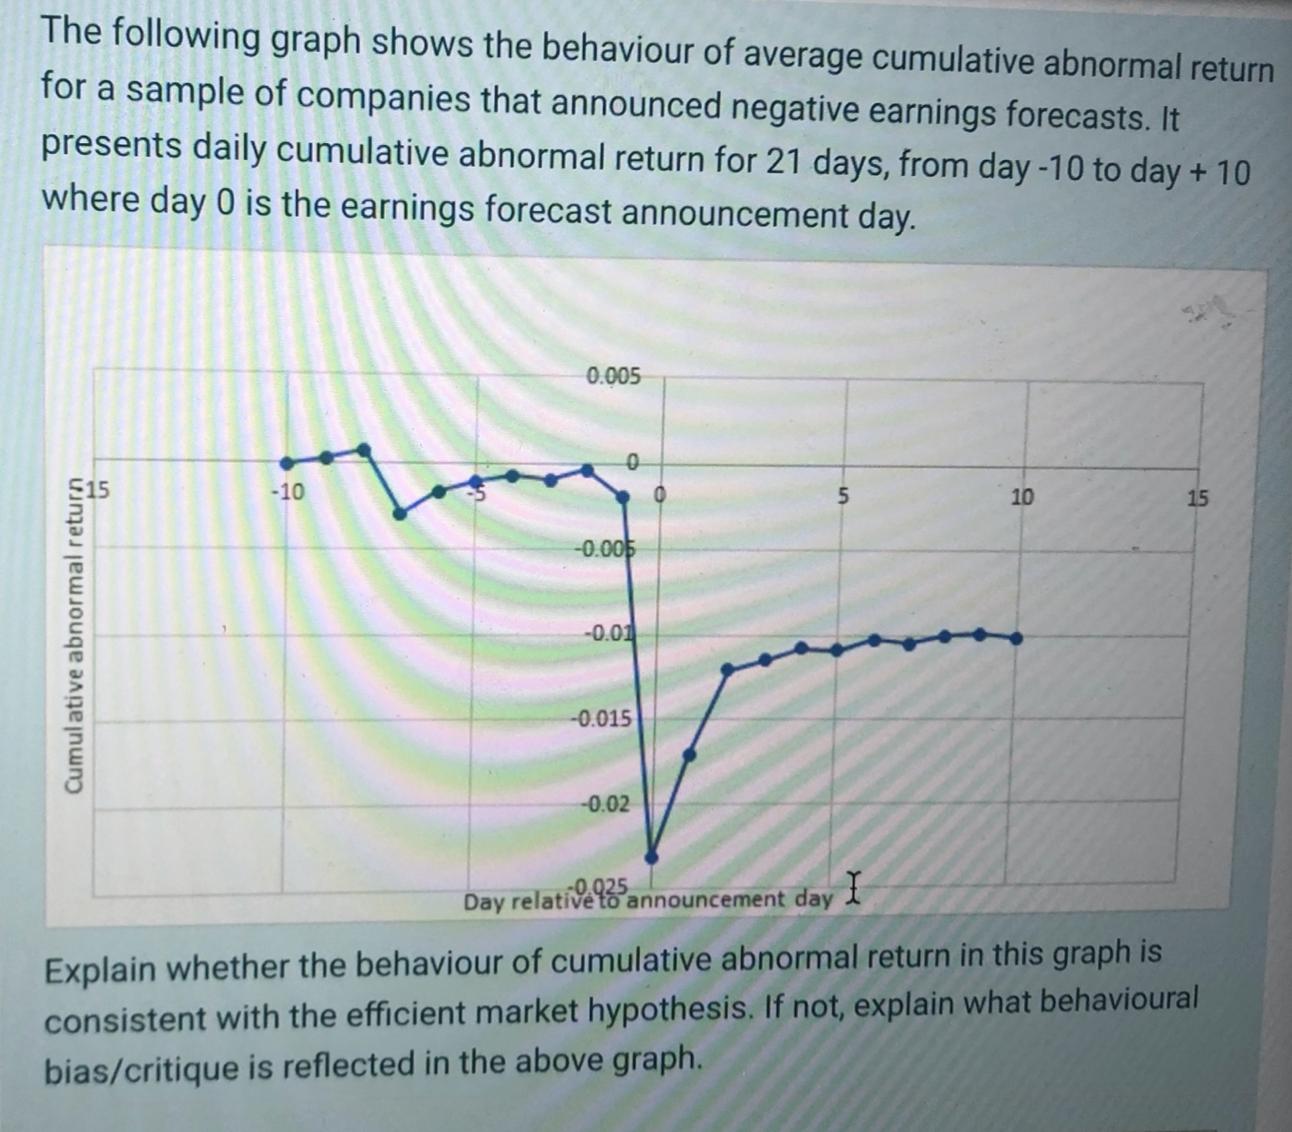
The following graph shows the behaviour of average cumulative abnormal return for a sample of companies that announced negative earnings forecasts. It presents daily cumulative abnormal return for 21 days, from day -10 to day + 10 where day 0 is the earnings forecast announcement day. Cumulative abnormal return -10 0.005 -0.005 -0.01 -0.015 -0.02 5 -0.025 Day relative to announcement day I 10 15 Explain whether the behaviour of cumulative abnormal return in this graph is consistent with the efficient market hypothesis. If not, explain what behavioural bias/critique is reflected in the above graph.
Step by Step Solution
★★★★★
3.41 Rating (145 Votes )
There are 3 Steps involved in it
Step: 1
ANSWER This graph is not consistent with strong Efficient market because strong Efficient market wil...
Get Instant Access to Expert-Tailored Solutions
See step-by-step solutions with expert insights and AI powered tools for academic success
Step: 2

Step: 3
Ace Your Homework with AI
Get the answers you need in no time with our AI-driven, step-by-step assistance
Get Started
Elementary Statistics
Authors: Neil A. Weiss
8th Edition
321691237, 978-0321691231