Answered step by step
Verified Expert Solution
Question
1 Approved Answer
The following graph shows the daily market demand and supply curves. The equilibrium market price is $25 per extra-large cardboard box. PRICE (Dollars per


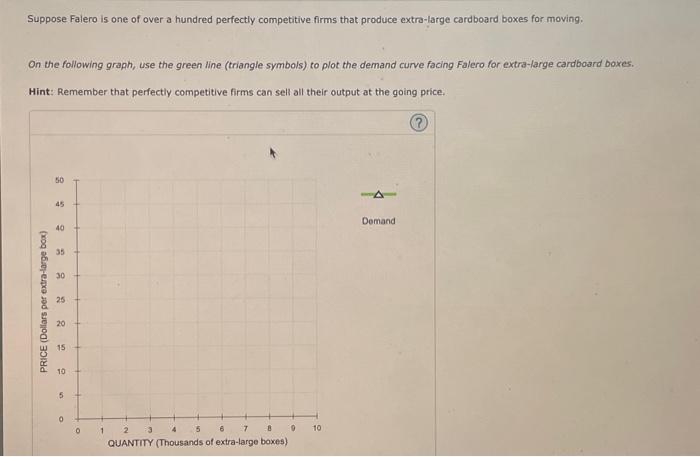
The following graph shows the daily market demand and supply curves. The equilibrium market price is $25 per extra-large cardboard box. PRICE (Dollars per extra-large box) 50 45 40 35 30 25 20 15 10 5 10 0 1 2 3 4 78 QUANTITY (Millions of extra-large boxes) Supply Demand 9 10 ? Suppose Falero is one of over a hundred perfectly competitive firms that produce extra-large cardboard boxes for moving. On the following graph, use the green line (triangle symbols) to plot the demand curve facing Falero for extra-large cardboard boxes. Hint: Remember that perfectly competitive firms can sell all their output at the going price. PRICE (Dollars per extra-large box) 50 45 40 35 30 25 20 15 10 5 0 + 0 7 8 1 2 3 4 QUANTITY (Thousands of extra-large boxes) 5 6 9 10 A Demand ? In the following table, fill in the total and marginal revenues that Falero earns for the first three boxes it sells each day. Total Output Price Total Revenue Marginal Revenue (Dollars per box) Average Revenue (Dollars per box) (Boxes) (Dollars) 0 1 2 3 (Dollars per box) 25 25 25 25 I 0 AAA The demand curve that Falero faces is identical to which of its other curves? Check all that apply.
Step by Step Solution
There are 3 Steps involved in it
Step: 1
Equilibrium price of the large cardboard box is determined by the intersection of market demand and market supply curve for cardboard box From the gra...
Get Instant Access to Expert-Tailored Solutions
See step-by-step solutions with expert insights and AI powered tools for academic success
Step: 2

Step: 3

Ace Your Homework with AI
Get the answers you need in no time with our AI-driven, step-by-step assistance
Get Started


