

Question
The following graph shows the PPP line in blue along with several hypothetical points, AA through EE, that represent combinations of inflation rate differentials and
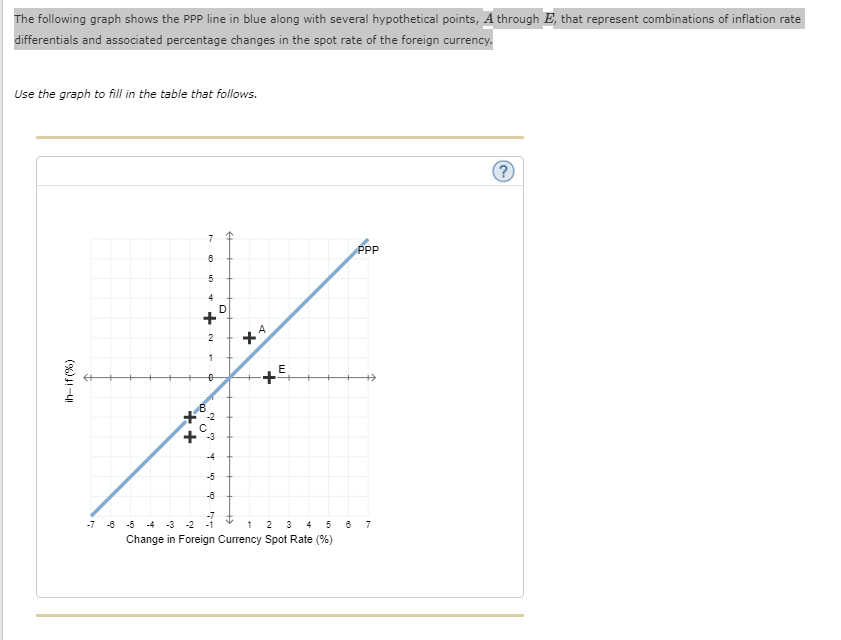
The following graph shows the PPP line in blue along with several hypothetical points, AA through EE, that represent combinations of inflation rate differentials and associated percentage changes in the spot rate of the foreign currency.
Step by Step Solution
There are 3 Steps involved in it
Step: 1

Get Instant Access to Expert-Tailored Solutions
See step-by-step solutions with expert insights and AI powered tools for academic success
Step: 2

Step: 3
Ace Your Homework with AI
Get the answers you need in no time with our AI-driven, step-by-step assistance
Get Started
Accounting Ledger Book
Authors: Alpha Planners Publishing
1st Edition
B09VWKPJSG, 979-8432472564