Question
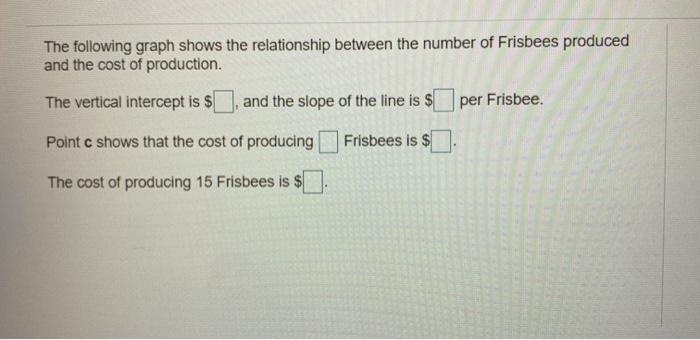
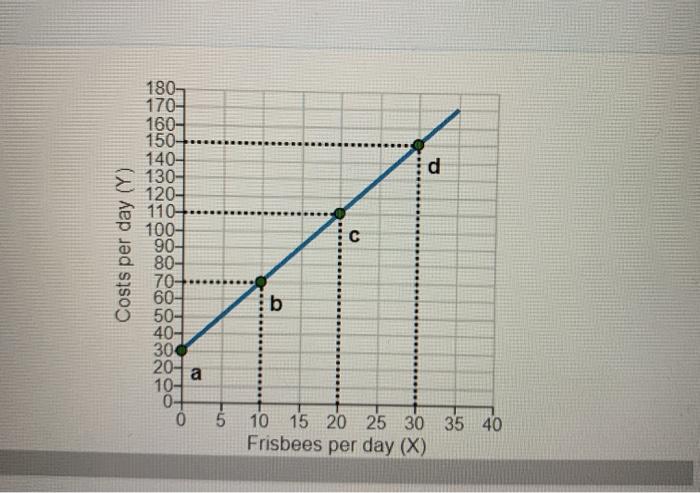
The following graph shows the relationship between the number of Frisbees produced and the cost of production. The vertical intercept is $ and the


The following graph shows the relationship between the number of Frisbees produced and the cost of production. The vertical intercept is $ and the slope of the line is $ per Frisbee. Point c shows that the cost of producing Frisbees is $ The cost of producing 15 Frisbees is $ 180- 170- 160- 150- 140- > 130- 120- 110- 100- 90- 80- 70- 60- 50- 40- 30 20- lb a 10- 0- 15 20 25 30 35 40 5 10 Frisbees per day (X) Costs per day (Y)
Step by Step Solution
3.44 Rating (167 Votes )
There are 3 Steps involved in it
Step: 1

Get Instant Access to Expert-Tailored Solutions
See step-by-step solutions with expert insights and AI powered tools for academic success
Step: 2

Step: 3

Ace Your Homework with AI
Get the answers you need in no time with our AI-driven, step-by-step assistance
Get StartedRecommended Textbook for
Introductory Statistics Exploring The World Through Data
Authors: Robert Gould, Colleen Ryan
2nd Edition
9780321978509, 321978277, 321978501, 978-0321978271
Students also viewed these Economics questions
Question
Answered: 1 week ago
Question
Answered: 1 week ago
Question
Answered: 1 week ago
Question
Answered: 1 week ago
Question
Answered: 1 week ago
Question
Answered: 1 week ago
Question
Answered: 1 week ago
Question
Answered: 1 week ago
Question
Answered: 1 week ago
Question
Answered: 1 week ago
Question
Answered: 1 week ago
Question
Answered: 1 week ago
Question
Answered: 1 week ago
Question
Answered: 1 week ago
Question
Answered: 1 week ago
Question
Answered: 1 week ago
Question
Answered: 1 week ago
View Answer in SolutionInn App


