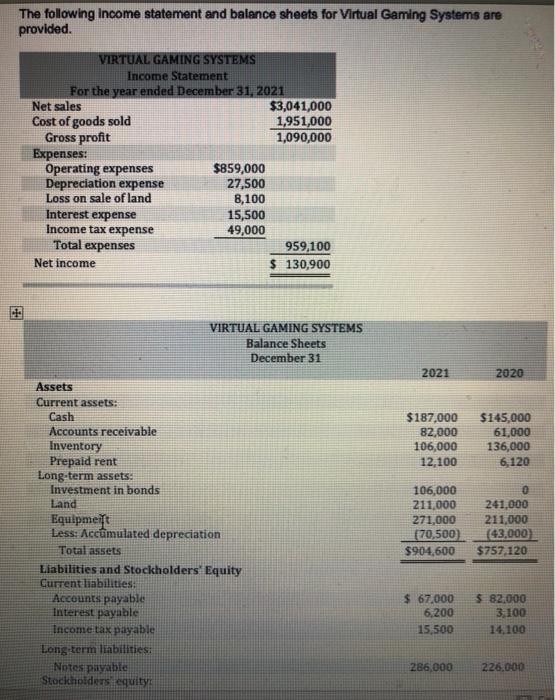
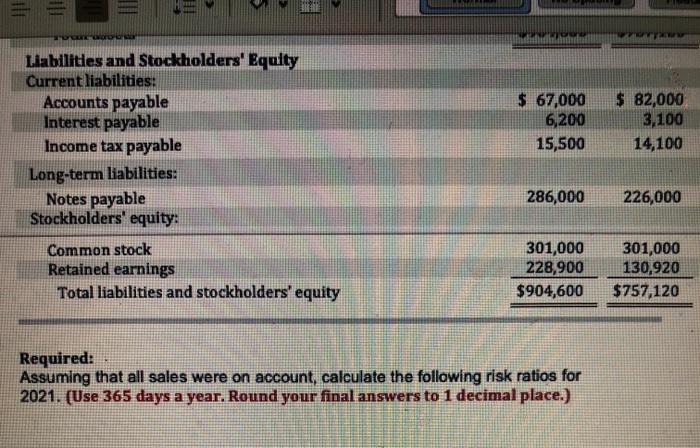
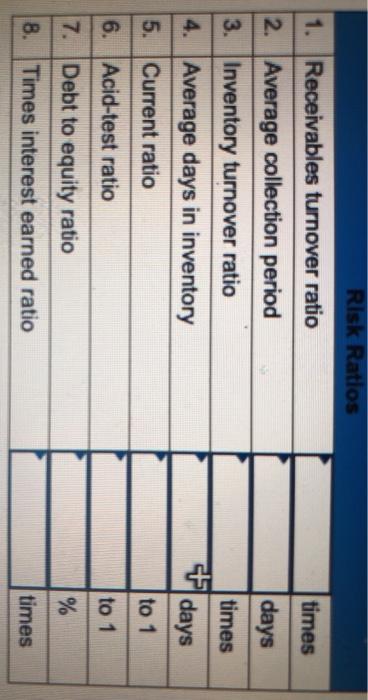
The following income statement and balance sheets for Virtual Gaming Systems are provided. VIRTUAL GAMING SYSTEMS Income Statement For the year ended December 31, 2021 Net sales $3,041,000 Cost of goods sold 1,951,000 Gross profit 1,090,000 Expenses: Operating expenses $859,000 Depreciation expense 27,500 Loss on sale of land 8,100 Interest expense 15,500 Income tax expense 49,000 Total expenses 959,100 Net income $ 130,900 VIRTUAL GAMING SYSTEMS Balance Sheets December 31 2021 2020 $187,000 82,000 106,000 12.100 $145,000 61,000 136,000 6,120 Assets Current assets: Cash Accounts receivable Inventory Prepaid rent Long-term assets: Investment in bonds Land Equipment Less: Accumulated depreciation Total assets Liabilities and Stockholders' Equity Current liabilities: Accounts payable Interest payable Income tax payable Long term liabilities Notes payable Stockholders equity 106,000 211.000 271,000 (70,500) $904,600 0 241,000 211,000 (43,000) $757,120 $ 67,000 6,200 15,500 $82,000 3.100 14,100 286,000 226,000 TO Decor $ 67,000 6,200 15,500 $ 82,000 3,100 14,100 Liabilities and Stockholders' Equity Current liabilities: Accounts payable Interest payable Income tax payable Long-term liabilities: Notes payable Stockholders' equity: Common stock Retained earnings Total liabilities and stockholders' equity 286,000 226,000 301,000 228,900 $904,600 301,000 130,920 $757,120 Required: Assuming that all sales were on account, calculate the following risk ratios for 2021. (Use 365 days a year. Round your final answers to 1 decimal place.) TH Risk Ratios times days 1. Receivables turnover ratio 2. Average collection period 3. Inventory turnover ratio 4. Average days in inventory 5. Current ratio times 7 days to 1 6. Acid-test ratio to 1 % 7. Debt to equity ratio 8. Times interest earned ratio times