Answered step by step
Verified Expert Solution
Link Copied!

Question

1 Approved Answer

[The following information applies to the questions displayed below. Selected comparative financial statements of Korbin Company follow: KORBIN COMPANY Comparative Income Statements For Years Ended
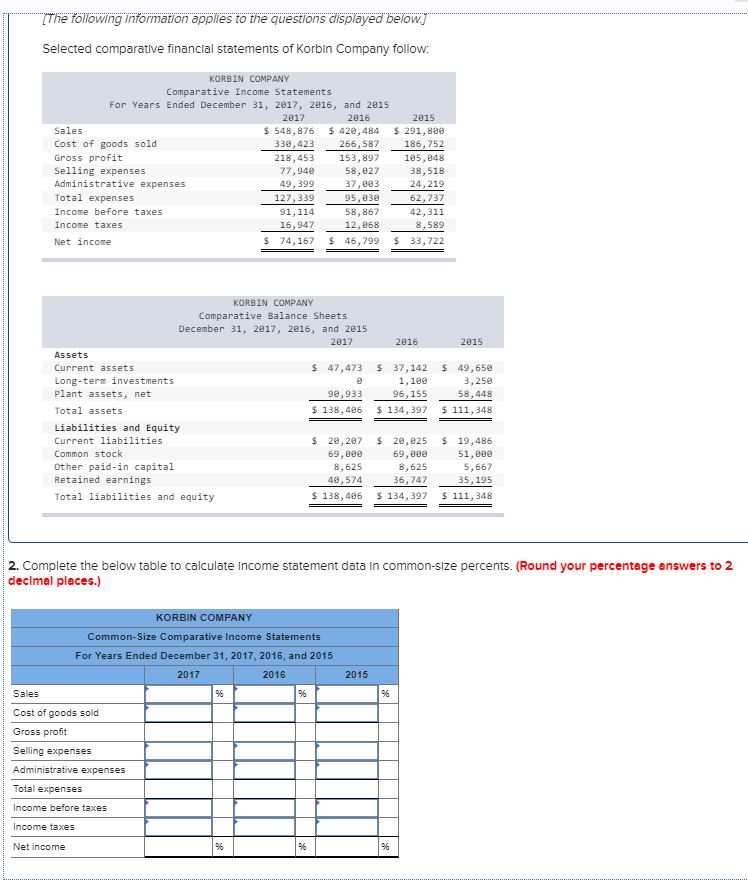
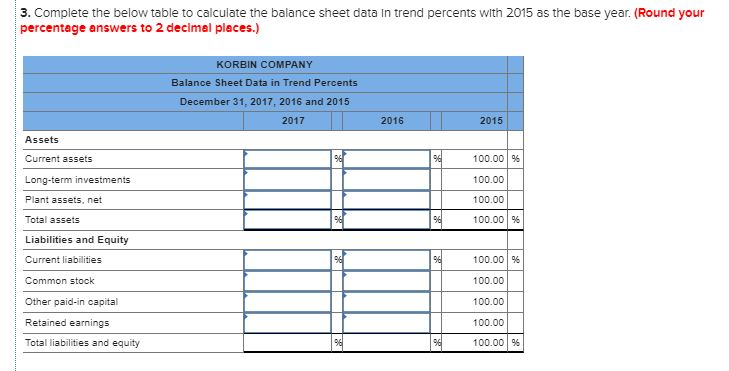
image text in transcribedimage text in transcribed

[The following information applies to the questions displayed below. Selected comparative financial statements of Korbin Company follow: KORBIN COMPANY Comparative Income Statements For Years Ended December 31, 2017, 2016, and 2015 2017 2016 2015 Sales $ 548,876 $ 420,484 $ 291, 880 Cost of goods sold 338,423 266,587 186,752 Gross profit 218,453 153,897 105,848 Selling expenses 77,940 58,827 38,518 Administrative expenses 49,399 37, e83 24,219 Total expenses 127,339 95,30 62,737 Income before taxes 91.114 58,867 42,311 Income taxes 16,947 12.068 8,589 Net income $ 74.167 $ 46.799 $ 33.722 KORBIN COMPANY Comparative Balance Sheets December 31, 2017, 2016, and 2015 2017 2016 2015 Assets Current assets $ 47,473 $ 37,142 $ 49,650 Long-term investments 0 1 .18 3,250 Plant assets, net 98,933 96,155 58,448 Total assets $ 138,486 $ 134, 397 $ 111,348 Liabilities and Equity Current liabilities $ 20,207 $ 20,625 $ 19,486 Common stock 69,880 6 9, eee 51,eee Other paid-in capital 8,625 8.625 5,667 Retained earnings 40,57436, 74735,195 Total liabilities and equity $ 138,496 $ 134, 397 $ 111,348 2. Complete the below table to calculate Income statement data in common-size percents. (Round your percentage answers to 2 decimal places.) KORBIN COMPANY Common-Size Comparative Income Statements For Years Ended December 31, 2017, 2016, and 2015 2017 2016 2015 Sales Cost of goods sold Gross profit Selling expenses Administrative expenses Total expenses Income before taxes Income taxes Net income 3. Complete the below table to calculate the balance sheet data in trend percents with 2015 as the base year. (Round your percentage answers to 2 decimal places.) KORBIN COMPANY Balance Sheet Data in Trend Percents December 31, 2017, 2016 and 2015 2017 2016 2015 Assets Current assets Long-term investments 100.00 % 100.00 100.00 100.00 % Plant assets, net Total assets Liabilities and Equity Current liabilities 100.00 % 100.00 Common stock Other paid-in capital 100.00 100.00 Retained earnings Total liabilities and equity 100.00 %

Step by Step Solution

There are 3 Steps involved in it

Step: 1

blur-text-image

Get Instant Access to Expert-Tailored Solutions

See step-by-step solutions with expert insights and AI powered tools for academic success

Step: 2

blur-text-image

Step: 3

blur-text-image

Ace Your Homework with AI

Get the answers you need in no time with our AI-driven, step-by-step assistance

Get Started

Recommended Textbook for

More Books

Students also viewed these Accounting questions

Question

Can a share dividend be reported as a liability?

Answered: 1 week ago

Question

How are current assets distinguished from fixed assets?

Answered: 1 week ago

Question

Evaluate the impact of unions on nurses and physicians.

Answered: 1 week ago

Question

Describe the impact of strikes on patient care.

Answered: 1 week ago

Question

Evaluate long-term care insurance.

Answered: 1 week ago